Introduction
To perform properly, a structure must interact favorably with the soil on which it rests. The modern geotechnical specialist, who often must build in areas that were considered too poor to build upon a few years ago, must be well versed in the fundamentals of soil mechanics. This knowledge will be used in the design of structural foundations and earthworks to answer the following questions. Will settlements be excessive? Can the structure tolerate settlements? Will the proposed foundation type perform better than another type? Can the foundation soils safely support the imposed embankment or footing loads? Will the proposed cut or fill slopes have adequate stability? Are the foundation and earthwork designs cost-effective?
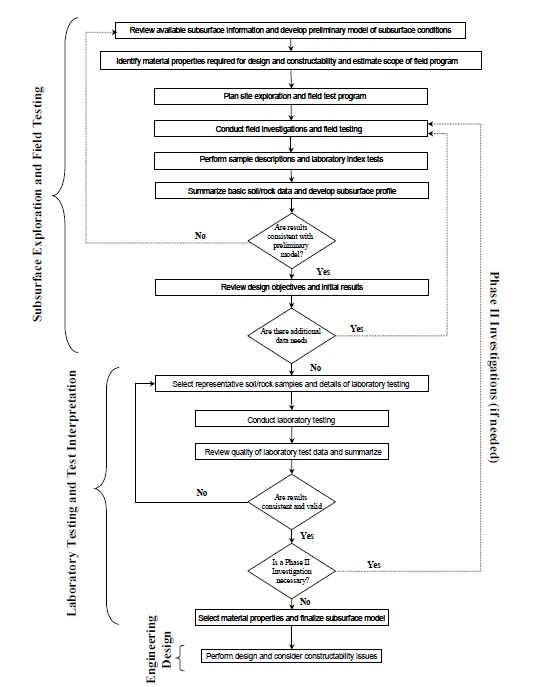
The engineer should have adequate knowledge of the subsurface conditions at a site before attempting to answer these questions. A site- and project-specific subsurface model must be developed for the cost-effective engineering design of a facility. Figure 1-1 shows a flow chart that identifies a recommended process for developing a subsurface model for engineering design. The investment of a few tens of thousands of dollars in a systematic approach as outlined in Figure 1-1 could result in design and construction savings of hundreds of thousands of dollars by preventing costly failures or overly conservative designs.
The process shown in Figure 1-1 is logical and is generally followed on many projects. In many cases, however, old “rules-of-thumb” and “status quo” approaches can result in an unconscious “by-passing” of critical steps. In particular, selection of the correct tests to determine the relevant engineering properties, the interpretation of the results of those tests, and summarization of data are often poorly performed. Rigorous attention to the rational process in Figure 1-1 is required to assure efficient and thorough exploration and testing programs, especially since many projects are fragmented to the extent that drilling, testing, and design are performed by different parties. This document provides guidance on all the items presented in Figure 1-1. The three major steps in the flow chart in Figure 1-1 and the applicable chapters in this document are as follows:
Step 1: Subsurface Exploration and Field Testing
Step 2: Laboratory Testing and Test Interpretation
Step 3: Engineering Design
1.1 Preparing for Subsurface Exploration
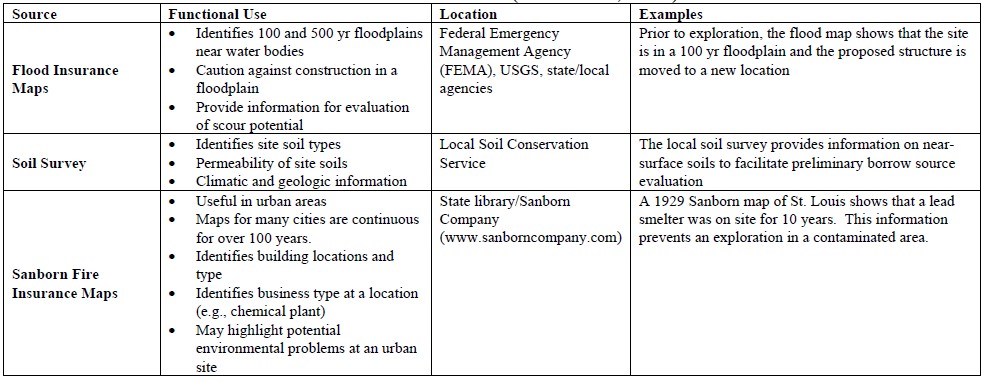
The initial step in any highway project must include consideration of the soil or rock on which the highway embankment and structures are to be supported. The extent of the site exploration will depend on many factors, not the least of which will be the project scheduling, general subsurface conditions, and the nature of the loads to be supported. In any event, certain basic steps should be followed before exploration equipment is mobilized to the project site. The first step in the exploration is to collect and analyze all existing data. A review of available information prior to the field reconnaissance will help establish what to look for at the site. In the Eighth Rankine Lecture, Glossop (1968) stated the following truism regarding site exploration: “If you do not know what you should be looking for in a site investigation, you are not likely to find much of value.” For a highway project, basic sources of geotechnical information should be reviewed to determine landform boundaries and to provide a basis for outlining the project subsurface exploration program. Those sources and functional uses are identified in Table 1-1.

A necessary part involved in review of existing data is to identify the major geologic processes that occurred at the project site because this will permit the geotechnical specialist to develop an understanding of how the local soil and rock formations may have developed. The soil formation process and consideration of landforms in designs of geotechnical features is discussed briefly followed by discussions of subsurface exploration programs.
1.1.1 Soil Formations and Landforms
Soils are a result of the weathering of rocks. In general, rocks are classified as igneous, sedimentary, and metamorphic. Igneous rocks are products of melts (magma) generated an unknown distance below the earth’s surface. Sedimentary rocks are cemented and/or compressed materials derived from pre-existing sediments deposited in layers by water or by air. A metamorphic rock is any rock that originates by a process of change from what it was previously. Any former igneous, sedimentary, or metamorphic rock can be metamorphosed (changed) into a new metamorphic rock by an increase in temperature and/or pressure and/or by reaction with surrounding hot fluids and gases. Regardless of the type of rock, most weathering takes place near the ground surface. Rock weathering can occur due to mechanical (physical) and/or chemical processes as follows:
- Mechanical or physical process refers to the process whereby the intact rock breaks into smaller fragments. Physical weathering may be caused by expansion resulting from unloading (e.g., exfoliation or spalling off of the exterior surface of the exposed rock),abrasion, temperature changes (e.g., freeze/thaw), erosion by wind or rain, crystal growth (e.g., ice and other crystals such as salt crystals that form as the result of the capillary action of water containing salts in solution), and organic activity (e.g., forces exerted by growing plants and roots in voids and crevasses of rock).
- Chemical process refers to the process whereby the minerals in the rock are altered into new compounds. Chemical weathering is usually preceded by hydration and hydrolysis and may be caused by, oxidation (e.g., chemical reaction with rainwater), solution (e.g., dissolution of limestone) and/or leaching (e.g., dissolution of the cementing agent in the rock). Chemical weathering commonly occurs by fluids seeping into the fractures caused by mechanical (physical) weathering processes. These fluids are chiefly acids created as rainwater dissolves carbon dioxide from the atmosphere and more carbon dioxide and organic acids from the soil. Most chemical weathering processes result in an increase in volume (that causes an increase in stress within the rock mass), lower density materials (e.g., soils), smaller particle sizes (e.g., clay sizes), and more stable minerals (that may decrease the rate of chemical weathering).
The combined effects of the mechanical and chemical weathering processes vary considerably with climate and the mineralogy of the parent rock. The chemical reactions proceed most rapidly and completely in humid tropics and subtropics and least effectively in cold or arid climates (Goodman, 1993). Thus, in the Arctic regions and deserts, the mechanical processes of physical weathering act virtually alone to gradually breakup the rock into a fractured or rubbled mass whereas, in the tropics, the two weathering processes work together rapidly first to break up the rock and then to alter newly exposed rock surfaces during a project’s life.
Once the intact rock is broken into fragments, the rate of weathering depends on the particle size and the climate. In general, small particles weather at a faster rate than large ones due to their larger surface area. The weathering processes can result in particle sizes that are not distinguishable by the naked eye (e.g., colloidal particle size) and can be identified only by equipment such as electron microscopes. Based on particle size, the principal terms used by civil engineers to describe soils are gravel, sand, silt and clay. For example, silt and clay particles are finer than the No. 200 sieve (0.075 mm) and exhibit varying properties in presence of water.
Soils created by a particular geologic process assume characteristic topographic features, called landforms, which can be readily identified by the geotechnical specialist. A landform contains soils with generally similar engineering properties and typically extends irregularly over wide areas of a project alignment. Early identification of landforms can be used to optimize the subsurface exploration program. Landforms may be described according to the method of formation as residual soil landforms or transported soil landforms. Soils commonly associated with these two types of landforms are briefly described as follows:
1.1.1.1 Residual Soils
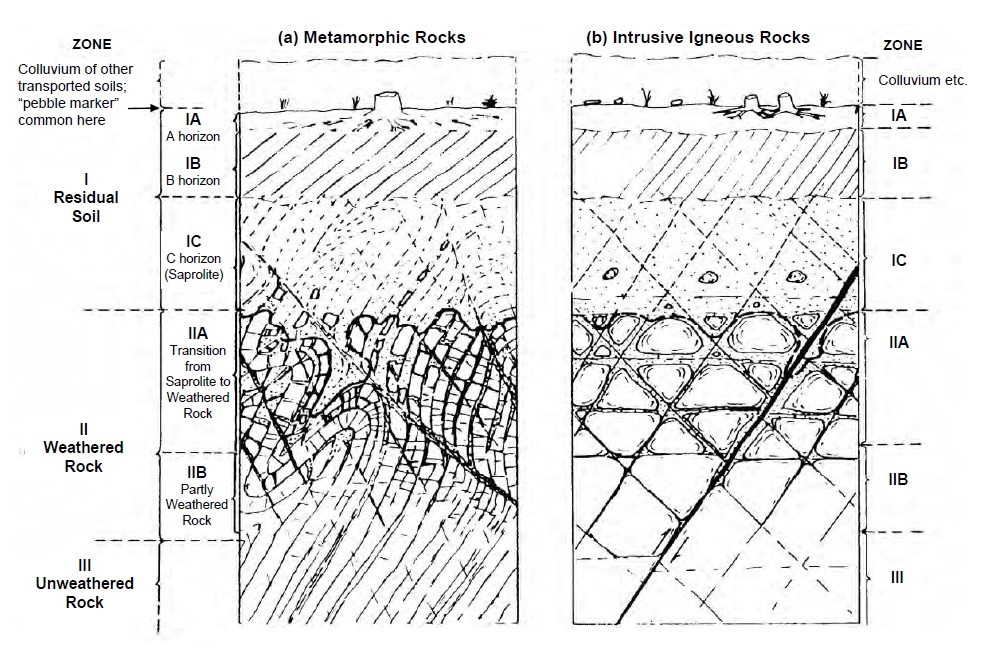
A residual soil landform is one that was formed in its present location through weathering of the parent (or bed) rock. Residual soils tend to be characterized by angular to subangular particles, mineralogy similar to parent rock, and the presence of large angular fragments within the overall soil mass. Because residual soil weathers from parent bedrock, its profile with depth represents a history of the weathering process. Figure 1-2 shows a typical weathering profile for metamorphic and igneous rocks. In Figure 1-2, the weathering profile is divided into three zones: residual soil, weathered rock, and unweathered rock. Deere and Patton (1971) present 12 other weathering-profile classification systems proposed by workers from around the world. Regardless of the weathering-profile classification, the following are some of the properties for such profiles:
- The permeability and shear strength gradually change with depth. These two parameters control both the amount of rainfall infiltration and the location of the shear surface when external loads are applied on or in these soils.
- Soil profile thickness and properties depend upon parent bedrock, discontinuities, topography, and climate. Because these factors vary horizontally, the profile can vary significantly over relatively short horizontal distances.
- Deep profiles form in tropical regions where weathering agents are especially strong and advanced stages of chemical weathering form cemented soils called laterites. The technical literature often refers to residual soils as tropical soils.
- The material in the transitory zone between residual soil and unweathered rock is called saprolite. Saprolites are generally unsaturated, weakly bonded and heterogeneous soils with relict joint systems (Lambe, 1996). Saprolites have widely varying void ratios and widely varying mineralogy and shear strength (Vaughn, et al., 1988).
1.1.1.2 Transported Soils
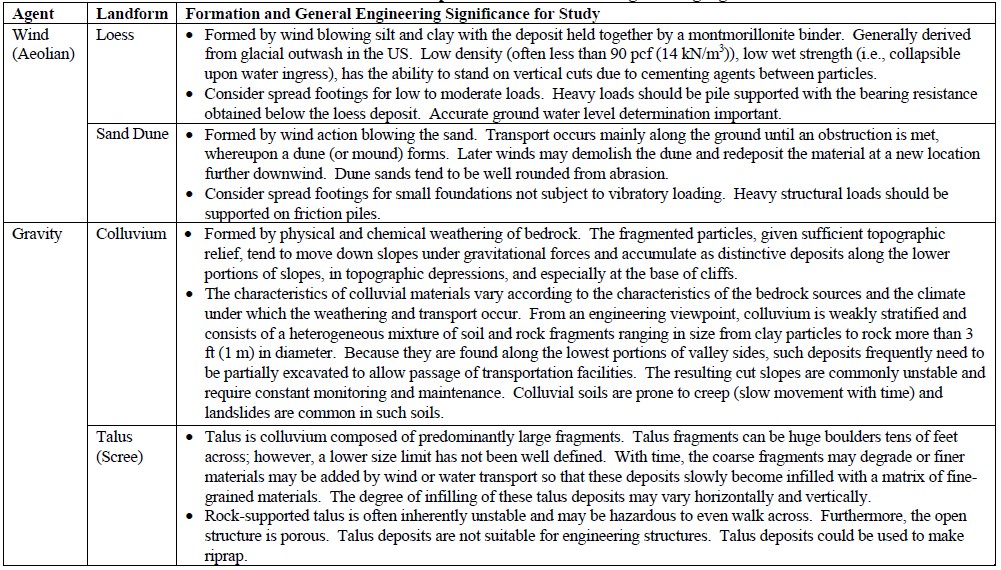
A transported soil is one that was formed from rock weathering at one location and transported by some exterior agent to another location. The transporting agent may be water (principal agent), a glacier, wind, and/or gravity. Often the deposits of transported soils are given names indicative of the mode of transportation causing the deposit, e.g., alluvial deposits, glacial till, etc. Transported soils are characterized by subrounded to rounded particles and a wide variety of particle sizes. Table 1-2 summarizes commonly encountered landforms composed of transported soils, their primary formational process, and their engineering significance.
1.1.1.3 Area Concept for Explorations Based on Landforms
Knowledge of the landforms and the engineering properties of the soils and rocks enables the designer to determine the most economical location for a highway alignment and grade, to evaluate design problems for each type of soil or rock, and to determine sources of granular borrow material. Once a landform is identified, the geotechnical specialist can develop an “area” concept for exploration. In this concept, the lateral extents of landforms in the immediate vicinity of the footprint of the proposed facility are first identified. Then, a limited exploration program (e.g., geologic mapping, geophysical work and some preliminary cone penetration tests and borings) is implemented at strategic locations such that the general characteristics of the landforms are identified. The exploration program can then be refined to obtain specific information on soil types of interest with respect to the footprint of the proposed facility and the anticipated loadings.


1.2 Field Reconnaissance
Application of the area concept requires the use of proper subsurface exploration equipment and techniques. In particular the use of wide area exploration techniques such as remote sensing and geophysical techniques can provide insight of general subsurface conditions in the project area economically. An adequate site exploration can be accomplished only under the direction of a geotechnical specialist who knows the general limitations of the exploration equipment as well as the general demands of the project. A field reconnaissance, preferably with the bridge designer, roadway designer, and project manager, is recommended to assess subsurface conditions prior to establishing a subsurface exploration.
The field reconnaissance should include:
- Inspection of nearby structures to determine their performance with the particular foundation type utilized. If settlement is suspected, the original structural plans should be reviewed and the structure surveyed by using the original benchmark.
- For water crossings, inspection of structural footings and the stream banks up and downstream for evidence of scour. Take careful note of the stream bed material. Often large boulders exposed in the stream but not encountered in the borings, are an indication of potential subsurface obstructions to pile installation.
- Recording the location, type, and depth of any existing structures or abandoned foundations that may infringe on the new highway facility.
- Relating site conditions to the proposed boring operations. Record potential problems with utilities (overhead and underground), site access, private property, or obstructions.
Figure 1-3 is an example of a field reconnaissance form used to record data pertinent to the site. Upon completion of the site inspection, the geotechnical specialist should prepare a terrain reconnaissance report in which the general suitability of the site is assessed. The report should:

- Flag major potential problems, which may preclude construction.
- Recommend beneficial shifts in location.
- Present a general discussion of expected subsurface conditions.
- Present cost estimate for extraordinary geotechnical treatments.
- Prepare an estimate of subsurface exploration quantities, costs, and time.
This information should be transmitted to all the groups involved with the project such as the project manager, roadway designer, and bridge designer.
1.3 Subsurface Exploration Program
The procedures employed in any subsurface exploration program are dependent on a variety of factors that vary from site to site. The project design objectives and the expected subsurface conditions have the major influence on the subsurface explorations. Highway projects necessarily involve both earthwork and structural foundations. Typical boring programs for highways on new alignments are established such that basic information is first gathered along the entire highway alignment and subsequent detailed borings are taken as required at the locations of structures or in problem earthwork areas as disclosed by the initial basic program. Subsurface explorations for widening or improvements of existing highways generally are done in one stage as the location is predetermined.
Consideration should be given, particularly for large or complex projects, to performing geologic mapping and geophysical explorations after the field reconnaissance and prior to any invasive explorations such as borings. Geologic mapping and geophysical explorations can be quick and provide a much larger coverage of the project area as compared to invasive explorations. The information from field reconnaissance, geologic mapping and geophysical explorations can then be used to setup the conventional subsurface exploration and testing program. Geophysical explorations are discussed in Section 1.15.
After the field reconnaissance and geophysical explorations are completed, “invasive” explorations using drilled borings and in-situ tests must be performed to obtain in-situ properties and physical samples for identification and testing. The sampling techniques and tools are discussed in Section 1.4 and other sections of this course. The objectives for such explorations are as follows:
- Determine stratigraphy.
- physical description and extent of each stratum.
- thickness and elevation of top and bottom of each stratum.
- For fine-grained soils (each stratum) determine:
- natural moisture contents.
- Atterberg limits.
- stiffness.
- presence of organic materials.
- evidence of desiccation or previous soil disturbance, shearing, or slickensides.
- swelling characteristics.
- unconfined compressive strength -typically estimated from Standard Penetration Tests or Cone Penetration Tests.
- shear strength.
- compressibility.
- For coarse-grained soils (each stratum) determine:
- in-situ density (average and range) typically determined from Standard Penetration Tests or Cone Penetration Tests.
- grain-size distributions (gradation).
- presence of organic materials.
- Determine depth to ground water (for each aquifer if more than one is present).
- piezometric surface over site area: existing, past, and probable range in future(observe at several times).
- perched water table.
- Determine depth to bedrock.
- depth over entire site.
- type of rock.
- extent and character of weathering.
- joints, including distribution, spacing, whether open or closed, and joint infilling.
- faults.
- solution effects in limestone or other soluble rocks.
- core recovery and soundness (RQD).
- hardness and strength.
1.4 Sampling Techniques and Tools
The purpose of this section is to provide information on various in-situ testing methods that are currently used to establish site-specific soil and rock properties for design and construction. The execution of a conventional subsurface exploration and testing program usually includes rotary drilling, Standard Penetration Testing (SPT), disturbed and undisturbed sample recovery, and laboratory testing. Although procedures for these commonly performed activities are described in AASHTO and ASTM standards and are well known to most geo-professionals, important testing details are sometimes overlooked that can result in data having marginal quality. This section discusses the importance of carefully selecting and properly conducting the appropriate field and/or laboratory testing method.
In-situ testing methods are increasingly being used on transportation projects, however testing procedures and test limitations are not as well understood as those of the more conventional methods of subsurface exploration and testing such as the use of drilled borings. In this course, procedures for various in-situ and laboratory testing methods are presented as they relate to obtaining high quality data for the evaluation of engineering properties of soils and rocks for transportation projects. Information on equipment calibration, measured test parameters, quality control, and the range of ground conditions that apply to each test is also presented.
Several in-situ tests define the geostratigraphy and provide direct measurements of soil properties and geotechnical parameters. The common in-situ tests include: Standard Penetration Test (SPT), Cone Penetration Test (CPT), Piezocone Test (CPTu), Flat Plate Dilatometer Test (DMT), Pressuremeter Test (PMT), and Vane Shear Test (VST). Although the load is applied differently in each test, the purpose of each test is to measure the corresponding response of the soil in an attempt to evaluate the soil’s engineering properties, such as strength and/or stiffness. Figure 1-4 depicts these various devices and a graphical representation of how load is applied.
Some state DOTs perform these tests by using agency-owned equipment. In many cases however, the agency may retain an outside contractor for these services either directly or as part of an overall project development package. Several technical reports and manuals are available that describe these test methods. A brief list of these references is provided in Table 1-3. Agencies that perform or contract for these testing services are encouraged to obtain the references identified in Table 1-3. In this course, only the SPT and the CPT tests will be discussed since they are the most commonly used.
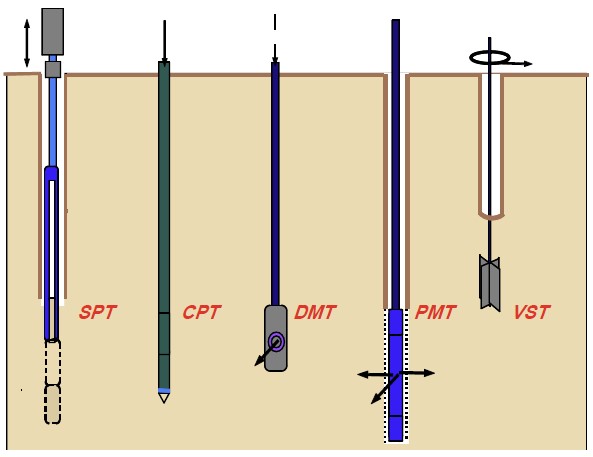
Boreholes are required for conducting the SPT and normal versions of the PMT and VST. Therefore a drill rig and crew are required for the performance of these tests. Boreholes are not required for the CPT, CPTu, and DMT; therefore these tests are called “direct-push” technologies. Although boreholes are not required for these tests, special mobilized equipment and data acquisition systems are required. Specialized versions of the PMT (i.e., full-displacement type) and VST can be conducted without boreholes. In such cases either standard drill rigs or mobile hydraulic systems (cone trucks) are used to push the probes to the required test depths. Obviously direct push test methods are not suitable in soil profiles that contain boulders, hard cemented layers and bedrock. For such profiles, borehole methods prevail as the testing device may be advanced through the hard layers by coring or non coring techniques. An advantage of direct-push soundings is that cuttings or spoil are not generated, however, this advantage is offset by a significant disadvantage, i.e., no soil sample is retrieved for classification or subsequent laboratory testing. Another advantage of the CPT and CPTu tests is that they provide a continuous record of soil response through the entire depth of the direct push. The other tests are performed at discrete intervals so that the soil’s response is measure at specific depths only. In addition, important layers can be missed with any of the discrete interval test methods.
1.5 Boring Methods
Geotechnical borings are a critical component of any subsurface exploration program. They are performed to satisfy several objectives including those listed below.
- identify the subsurface distribution of materials with distinctive properties, including the presence and thickness of distinct layers;
- retrieve samples of each layer for laboratory tests to determine engineering properties;
- determine depth to groundwater; and
- provide access for the introduction of in-situ testing devices.
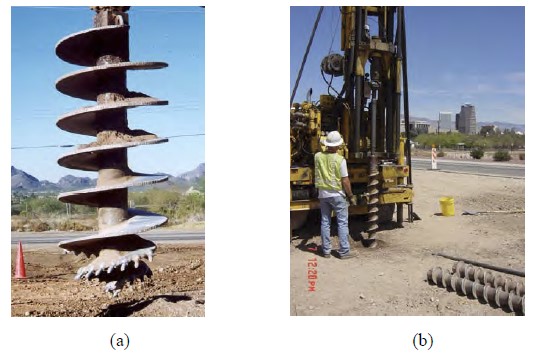
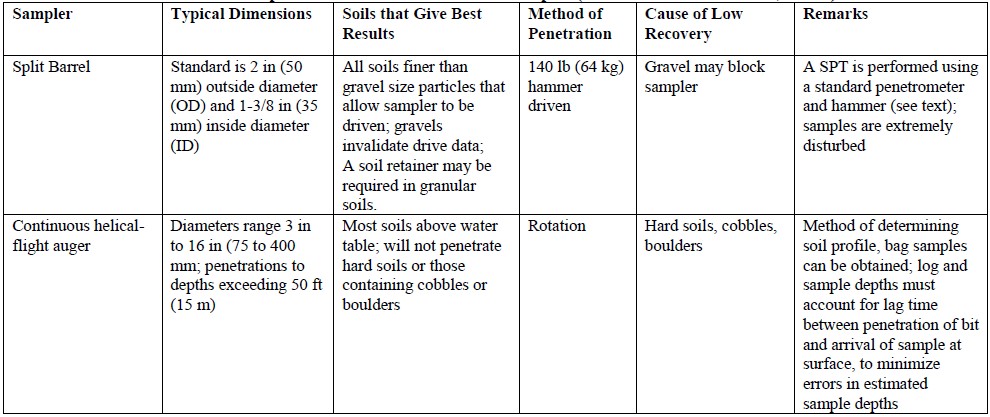
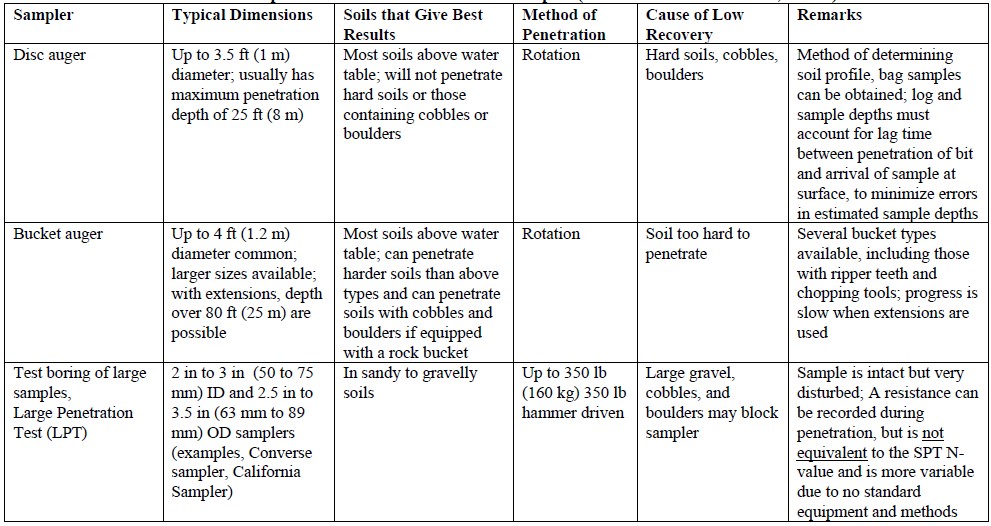
There are many types of equipment used in current practice for advancing a soil or rock boring. Typical types of soil borings are listed in Table 1-4(a), rock coring methods in Table 1-4(b), and other exploratory techniques in Table 1-4(c). Detailed information on soil and rock boring procedures can be found in AASHTO (1988), FHWA (2002b), and ASTM D 4700. A brief description of typical soil boring methods is provided below (Day, 1999).
1.5.1 Auger Borings
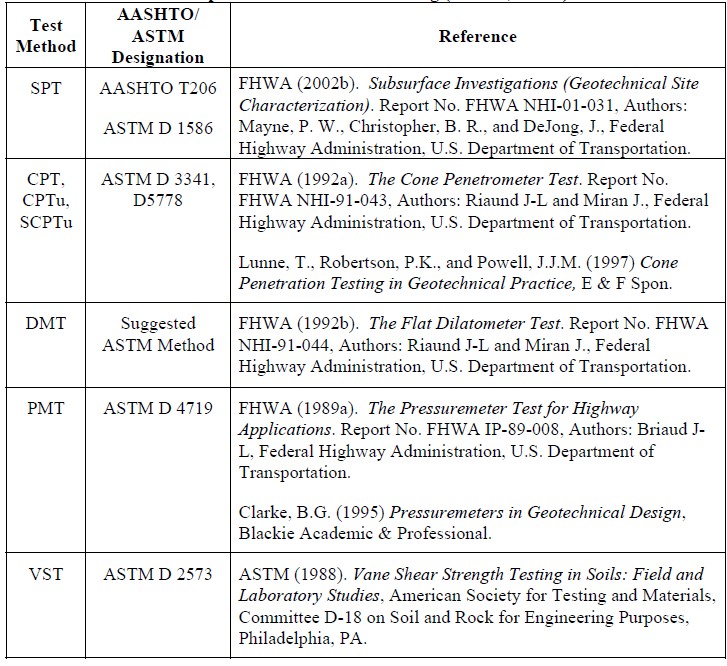
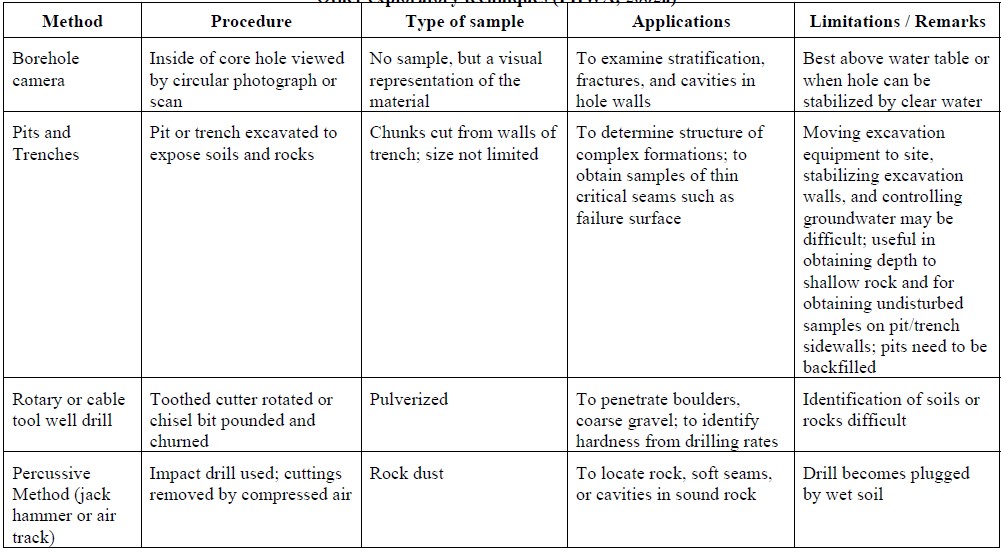
An auger is an apparatus with a helical shaft that can be manually or mechanically advanced to bore a hole into soil. Large and small diameter augers are shown in Figure 1-5. The practice of advancing a borehole with a mechanical auger consists of rotating the auger while applying a downward pressure on the auger to penetrate soil and possibly weak or weathered rock. The auger may be continuous, where the helix extends along the entire length of the shaft, or discontinuous when the auger helix is at the bottom of the drill stem.
- Discontinuous or single flight auger borings and bucket auger borings. There are basically two types of discontinuous augers: discontinuous flight augers and bucket augers. Commonly available discontinuous flight augers have diameters ranging from 0.25 to 3 ft (0.075 to 1 m) and bucket augers have diameters ranging from 1 to 8ft (0.3 to 2.5 m). For discontinuous flight auger borings, the auger is periodically removed from the hole and the soil lodged in the grooves of the flight auger is removed. When a bucket auger is used, it too is periodically removed from the hole and the soil in the bucket removed. A casing is generally not used for discontinuous flight and bucket auger borings. Therefore, these methods are not recommended for boreholes deeper than 35 ft (10 m), or where the hole may cave-in during the
excavation of loose or soft soils, or when the boring is below the groundwater table. In firm stiff clays, discontinuous auger borings can be performed to depths in excess of 35 ft (10 m).
Continuous flight auger borings. As the name implies, continuous flight augers have the auger flights continuous along the entire length of the auger. As shown in Figure 1-6a,there are two types of continuous flight augers: solid stem and hollow stem. For both of these type augers the drill cuttings are returned to the ground surface via the auger flights. The solid stem auger must be removed from the borehole to allow access to the hole for insertion of sampling or testing devices. Because the auger must be periodically removed from the borehole, a solid stem auger is not appropriate in sands and soft soils or in soil deposits where groundwater is close to the surface. A hollow-stem auger has a circular hollow core that allows for sampling through the center of the auger. As shown in Figure 1-6c, hollow-stem augers come in a variety of diameters. The hollow-stem auger acts like a casing and allows for sampling in loose or soft soils or when the excavation is below the ground water table. A plug (Figure 1-6d) is necessary when hollow stem augers are advanced to prevent cuttings from migrating through the hollow stem. The plug is removed to permit SPT sampling. In loose sands and soft clays extending below the water table, drilling fluids are often used to minimize and mitigate disturbance effects and keep the hole open. The components of the hollow stem auger system are shown in Figure 1-6b.
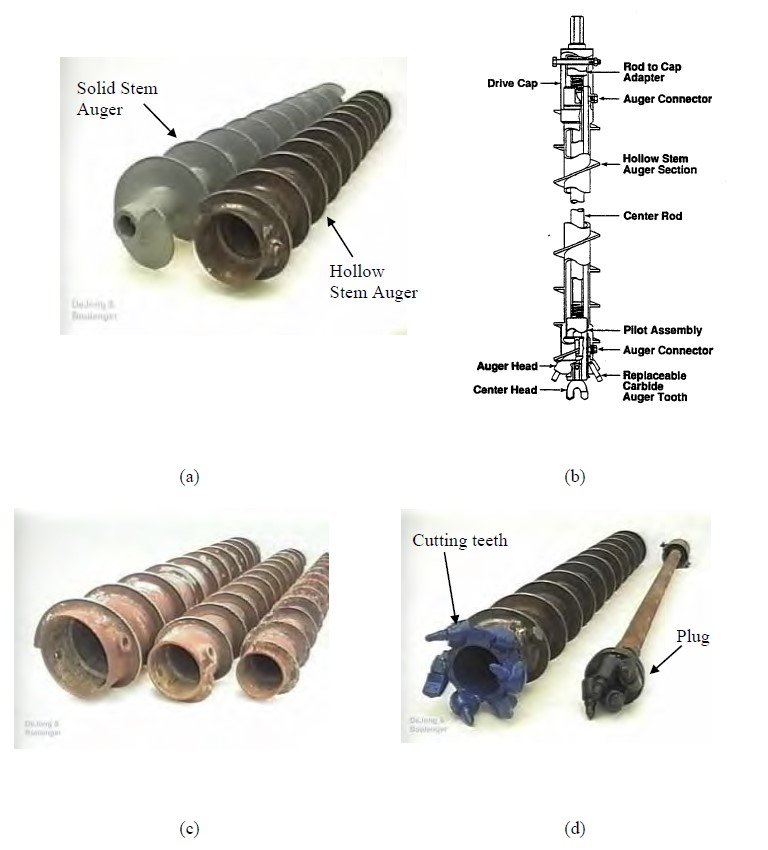
1.5.2 Wash-type Borings
Wash-type borings use circulating drilling fluid (e.g., water or mud) to remove cuttings from the borehole, Figure 1-7. Cuttings are created by the chopping, twisting, and jetting action of the drill bit that breaks the soil or rock into small fragments. Tri-cone bits are often used in dense soil or soft rock. If bentonite or a polymeric drilling mud cannot be used to maintain an open borehole, casings are often used to prevent cave-in of the borehole. The use of casing will require a significant amount of additional time and effort but will result in a protected borehole. When drilling mud is used during subsurface boring, it will be difficult to classify the soil from the auger cuttings because of contamination with the mud. Also, the outside of samples may become coated with drilling mud.
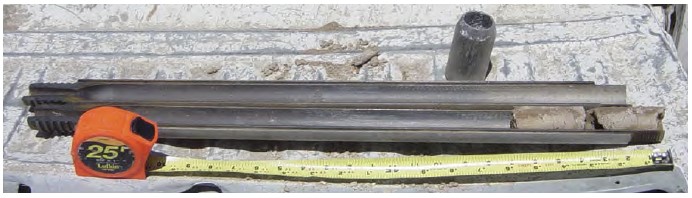
The properties of the drilling fluid and the quantity of water pumped through the drill bit will determine the size of particles that can be removed from the boring with the circulating fluid. In formations containing gravels, cobbles, or larger particles, coarse material may be left at the bottom of the boring. In these instances, cleaning the bottom of the boring with a larger diameter sampler (such as the 3 in (75 mm) OD split barrel sampler) may be needed to obtain a representative sample of the formation.
1.5.3 Coring in Rocks
The previously described methods are typically used for soil exploration. The following methods are primarily used for rock exploration.
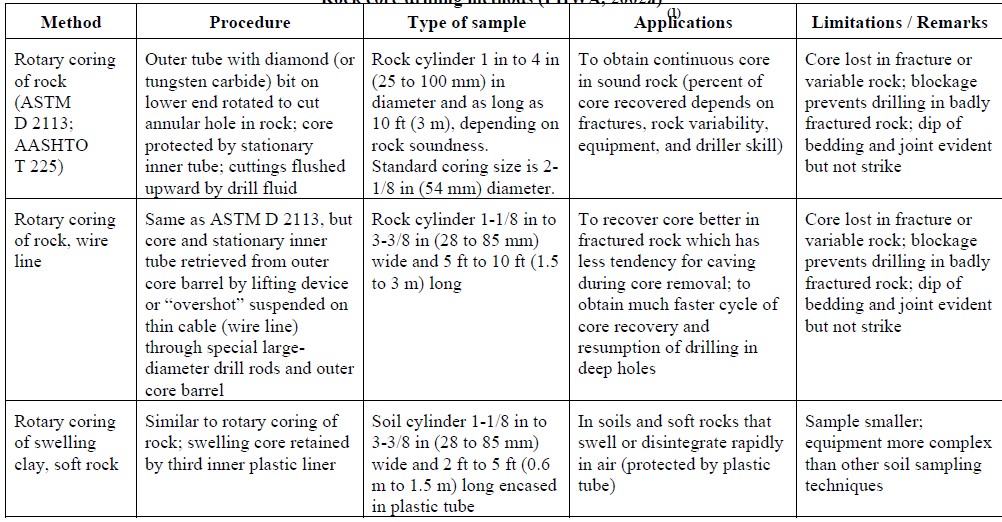
- Rotary coring. This type of coring equipment is most commonly used for rock exploration when an intact core of the rock is desired. Power rotation of the drilling bit is accompanied with introduction of a circulating fluid to remove cuttings from the hole. The drilling bits are specifically designed to core rock, and inner/outer tubes or casings are used to capture the intact core. Table 1-4(b) lists various types of rotary coring techniques for rock, although many of these techniques are also applicable to dense or stiff soil.
- Percussion drilling. This type of drilling equipment is often used to penetrate hard rock for subsurface exploration or for the purpose of drilling wells. The drill bit works much like a jackhammer, rising and falling to break up and crush the rock material. Air is commonly used to clean the hole and transport the cuttings to the ground surface. Table 1-4(c) includes a description on the use of the percussion drilling techniques.
(b) Typical drilling configuration, (c) Settling basin (mud tank).
1.6 Sampling Methods
1.6.1 Disturbed Sampling of Soil
Disturbed sampling of soil provides a means to evaluate stratigraphy by visual examination and to obtain soil specimens for laboratory index testing. Disturbed samples are usually collected using split-barrel samplers (Figure 1-8; AASHTO T 206, ASTM D 1586), although several other techniques are available for disturbed sample collection in boreholes (see Table 1-5(a) and 1-5(b)). Shallow disturbed samples can also be obtained by using hand augers and test pits. Direct push methods, such as GeoProbe sampling, can be used to obtain continuous disturbed samples but these methods have limitations in sampling depth similar to those of solid stem and bucket augers (i.e., generally good for depths less than 33 feet (10meter) unless in firm to stiff clays). Samples obtained via disturbed sampling methods are generally used for index property testing in the laboratory. They should not be used to prepare specimens for consolidation and strength tests.
1.6.2 Undisturbed Sampling of Soil
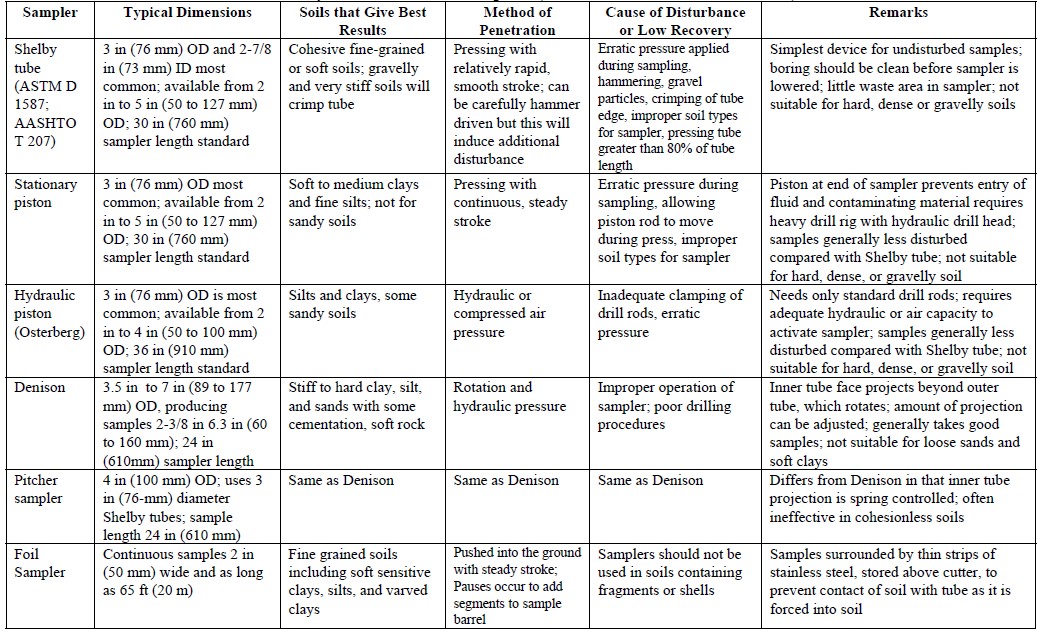
Undisturbed soil samples are required for performing laboratory strength and consolidation tests on cohesive soils having consistencies ranging from soft to stiff. High-quality samples for such tests are particularly important for approach embankments and for structural foundations and wall systems that may stress compressible strata. In reality, it is impossible to retrieve truly undisturbed samples since changes in the state of stress in the sample occur upon sampling and removal of the sample from depth. The goal of high-quality undisturbed sampling is to minimize the potential for: (1) alteration of the soil structure; (2) changes in moisture content or void ratio; and (3) changes in chemical composition of the soil. Due to cost and ease of use, the thin-walled Shelby tube (Figure 1-9) is the most commonly used sampler for obtaining relatively undisturbed samples of soft to stiff fine-grained soils.
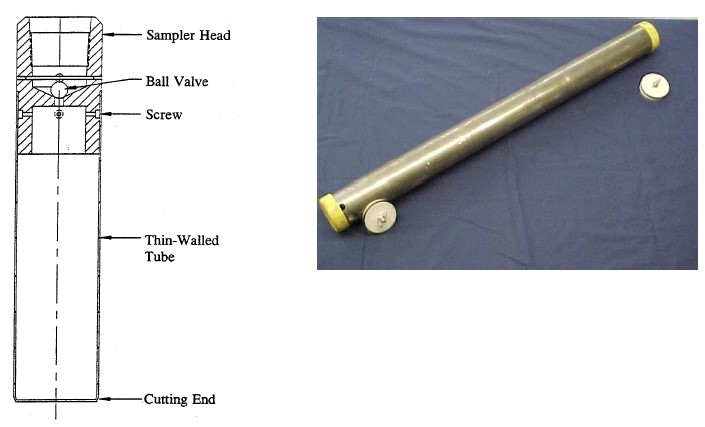
Thin walled Shelby tube sampling is discussed in Section 1.5.3. Depending upon the in-situ condition of the fine-grained soil (e.g., stiffness and whether significant granular material is in the soil matrix), alternative sampling devices may be used to obtain nominally undisturbed soil samples. These alternative samplers include:
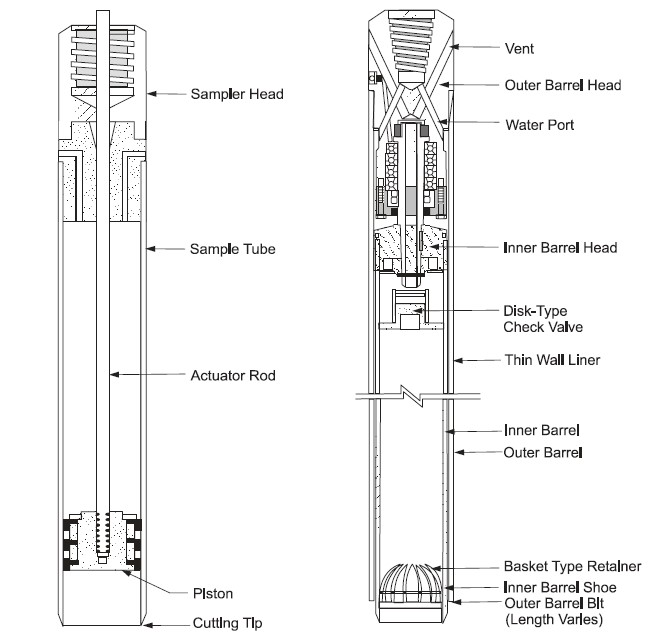
- Stationary piston sampler (Figure 1-10);
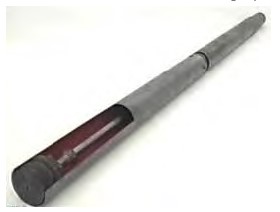
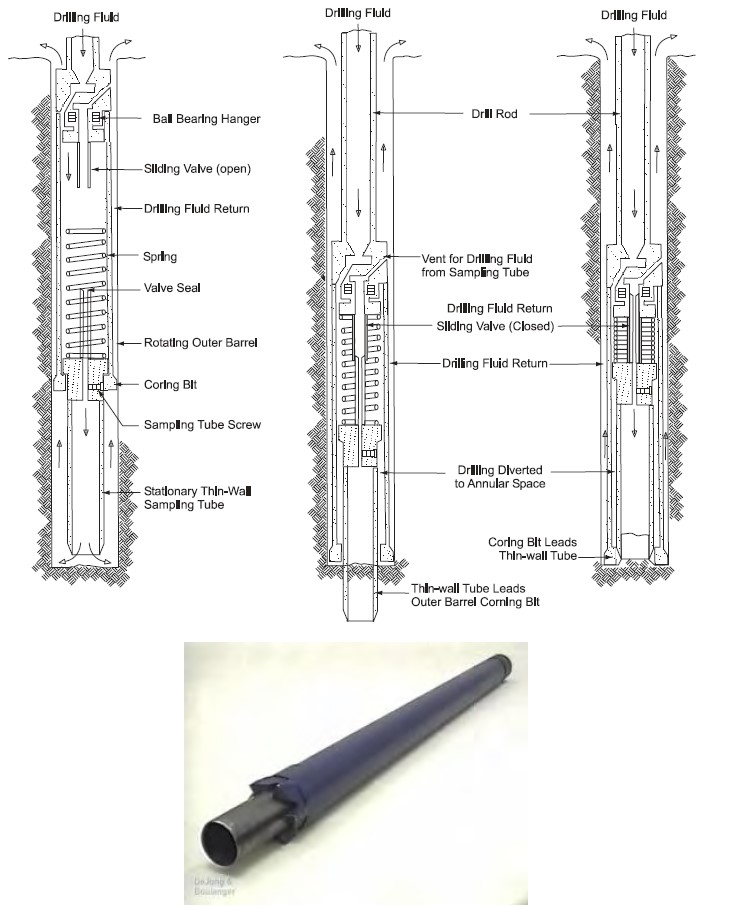
- Denison sampler (Figure 1-11);
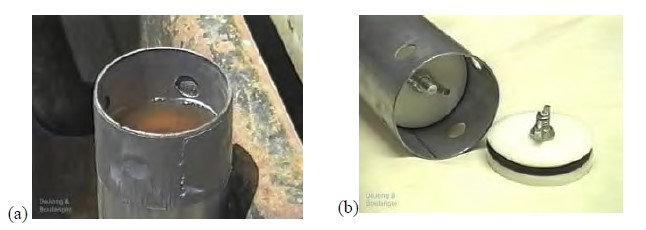
- Pitcher samplers (Figure 1-12);
- Hydraulic piston sampler (Osterberg Sampler).
Summary information on these samplers is provided in Table 1-6 and detailed procedures for these sampling techniques are provided in FHWA (1997, 2002b). Although not common for typical transportation-related projects, a variety of special samplers are available to obtain samples of soil and soft rocks. These specialty samplers include the retractable plug sampler, the Sherbrooke sampler, and the Laval sampler.
When dealing with relatively shallow soils that are very stiff, brittle, partially cemented, or that contain coarse gravel or stones, the best method to obtain large relatively undisturbed samples is by block sampling. Block sampling involves isolating a soil column, encasing it in paraffin wax, and covering it with an open-ended box or tube (usually about 12 in (300 mm)square). The bottom is cut, sealed and covered, and the sample is transported to the laboratory. This sampling technique is generally difficult to implement at depths greater than approximately 10 ft (3 m).
1.6.3 Thin-Walled (Shelby) Tube Sampling
The importance of appropriate sampling practice using Shelby tubes cannot be overemphasized. Poor sampling practices, exposure to extreme temperatures, and careless handling of samples can cause sample disturbance that may result in misleading test results that can lead to uneconomical or unsafe designs. • Geometry of a Thin-Walled Tube: The area ratio (AR) and the inside clearance ratio(ICR) are parameters that are used to evaluate the disturbance potential for different types of soil samplers. These parameters are defined as follows:

where De = diameter at the sampler cutting tip, Di = inside diameter of the sampling tube, and Do = outside diameter of the sampling tube. For a sample to be considered undisturbed, the ICR should be approximately 1 percent and the AR should be 10 percent or less. Using a tube with this ICR value minimizes the friction buildup between the soil sample and the sampler during the advancement of the sampler. Using a tube with an AR value less than 10 percent enables the sampler to cut into the soil with minimal displacement of the soil. Thin-walled tubes (e.g., Shelby tubes) are typically manufactured to meet these specifications, but a thicker walled tube with an ICR of zero is commonly used in the Gulf states (e.g., Texas, Louisiana) to sample very stiff overconsolidated clays. The use of the thicker walled tube minimizes buckling of the sampler in the stiff deposits, and the ICR of zero minimizes sample expansion within the tube. Additional information on suitable geometry for thin-walled tubes is provided in ASTM D 1587.
- Sample Tube Inspection and Storage: Tubes received from the manufacturer should be inspected to assure that no damage has occurred to the ends of the tubes. Plastic endcaps, which will later be used to facilitate securing of the sample, should be placed on the ends of the tube at this time.
- Cleaning Borehole Prior to Sampling: Depending upon the methods used, drilling and sampling procedures will cause some disturbance in the vicinity of the advancing face of a borehole. This is especially the case if a sample is over pushed, if casing is advanced ahead of the borehole, or during continuous sampling operations. It is recommended that a borehole be advanced and cleaned to two to three diameters below the bottom of the previous sample to minimize disturbance. Additionally, after advancement of the borehole, caving may occur at the bottom of the hole. Thus, the bottom of the borehole should be cleaned out thoroughly before the sampling device is advanced. Improper cleaning will lead to severe disturbance of the upper material (accumulated settled material), and possibly disturbance of the entire sample. Cleaning is usually performed by washing materials out of the hole. It should be ensured that the jet holes are not directed downward, for this will erode soft or granular materials to an unknown depth. All settled material should be removed to the edge of the casing. In deep or wide borings, special cleaning augers may be used to decrease time for cleaning and produce a cleaner hole.
- Tube Advancement and Retrieval: Tubes should be advanced without rotation in a smooth and relatively rapid manner. The length of the sampler advancement should be limited to 24 in (600 mm) for a 30 in (760 mm) long tube to minimize friction along the wall of the sampler and allow for loose material in the hole. The amount of recovery should be compared to the advanced length of the sampler to assess whether material has been lost, the sample has swelled, or some caved material has been collected at the top of the tube. The possible presence of caved material should be noted at the top of the tube so that no laboratory moisture content or performance tests are performed on that material. After advancing to the target depth, the drill rod should be rotated one full turn to shear off the bottom of the sample. Prior to shearing, a waiting period of 5 to 15minutes is recommended for tubes in soft soils to permit the sample to reach equilibrium inside the tube and prevent the sample from falling out the bottom of the tube during retrieval. This waiting period may be reduced for stiffer soils.
- Preparation for Shipment: Upon removal of the sample from the borehole, the ends should be capped with the plastic end caps and the tube should be labeled. The label should be written directly on the tube with a permanent marking pen, and include: (1)tube and boring identification number; (2) sample depth; (3) top and bottom of sample;(4)length of recovery; (5) sampling date; (6) job name and/or number; and (7) sample description. Tube samples that are intended for laboratory performance testing (i.e., strength, consolidation, hydraulic conductivity) should never be extruded from the tube in the field and stored in alternative containers. Samples should be extruded only in the laboratory under controlled conditions. After a thin-walled tube sample has been taken, slough or cuttings from the upper end of the tube should be removed by use of a cleanout tool. The length of sample recovered should be measured and the soil classified for the log. About 1 in (25 mm) of material at the bottom end of the tube should be removed and the cuttings placed in a properly labeled storage jar. Both ends of the tube should then be sealed with at least a 1 in (25 mm) thick layer of microcrystalline (non-shrinking) wax after a plastic disk has been placed to protect the ends of the sample (Figure 1-13a). The use of relatively low temperature wax will minimize shrinkage and potential moisture migration within the sample. The remaining void above the top of the sample should be filled with moist sand. Plastic end caps should then be placed over both ends of the tube and electrician’s tape wrapped over the joint between the collar of the cap and the tube and over the screw holes. The capped ends of the tubes are then dipped in molten wax. Alternatively, O-ring packers can be inserted into the sample ends and then sealed (Figure 1-13b). This method of sealing the sample may be preferable as it is cleaner and more rapid than waxing. In both cases, the sample must be sealed to ensure proper preservation of the sample. The tube should be kept vertical, with the top of the sample in the upright position. If the sample needs to be inverted for purposes such as sealing, care should be taken to ensure the sample does not slide within the tube. Samples must be stored upright in a protected environment to prevent freezing, desiccation, and alteration of the moisture content (ASTM D 4220).
- Shipment: Sample tubes must to be packed upright in accordance with guidelines provided in ASTM D 4220, or in an equivalent sample box. Tubes should be isolated from other sample tubes, and fit snugly in the case to protect against vibration or shock. The cushioning material between the samples should be at least 1 in (25 mm) thick, and the cushioning on the container floor should be at least 2 in (50 mm) thick. The samples should not be exposed to extreme heat or cold. If possible, the geotechnical specialist should deliver the samples to the laboratory or use a special delivery service provider who offers shipping of fragile items (e.g., FedEx) to ship samples. The use of a chain of custody form for sample traceability records is encouraged.
1.6.4 Undisturbed Sampling of Rock (Rock Coring)
When equipment for rock coring is being considered, the dimensions, type of core barrel, type of coring bit, and drilling fluid are important variables. The minimum depth of rock coring should be determined based on the local geology of the site and the type of structure to be constructed. Coring should also be performed to a depth that assures that refusal is not encountered on a boulder. A brief description of issues related to rock coring is provided in this document. Additional information on drilling rigs, methods of circulating drill cuttings (i.e., fluid or air), hole diameters, and casings is provided in ASTM D 2113.
1.6.4.1 Core Barrels
Four different types of core barrels are described in ASTM D 2113 including:
- Single Tube – Figure 3-14(a);
- Rigid Double Tube – Figure 3-14(b);
- Swivel Double Tube – Figure 3-14(c); and
- Triple Tube.
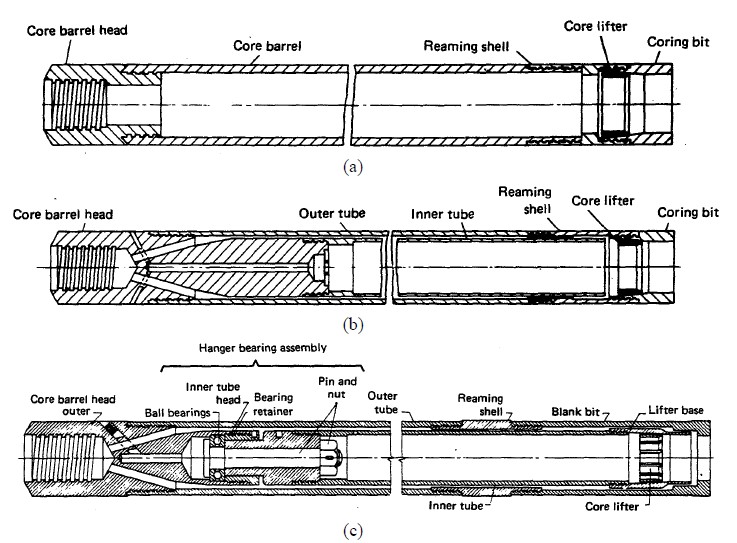
Since the double core barrel isolates the rock from the drilling fluid stream to yield better recovery, it is the minimum standard of core barrel that should be used in practice when an intact core is required for testing. Figure 3-15 shows the outer and inner assembly for a double-tube core barrel. The inner tube of a swivel-type core barrel does not rotate during drilling, which results in less disturbance and better recovery in weak and fractured rock. Rigid type double tube core barrels should not be used where core recovery is a concern. Triple tube swivel-type core barrels will produce better recovery and less core breakage than a double tube barrel.
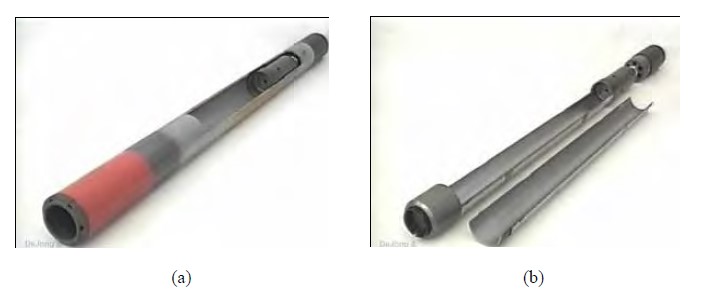
Most rock coring today is done by use of the wireline method, which was introduced in the 1960s. In this method, an inner tube containing the core is detached from the core barrel assembly when the core barrel is full or a blockage occurs. The tube and core contained in it are pulled to the surface by wire dropped down the string of drill rods. A latch or “overshot assembly,” which snaps on to the top of the inner tube, is used for this purpose. The inner tube is then rapidly hoisted to surface within the string of drill rods. After the core is removed, the inner tube is dropped down into the outer core barrel and drilling resumes. Thus, the core is retrieved without having to pull all of the rods and production rates, particularly for deep cores, are therefore greater than those for conventional techniques.
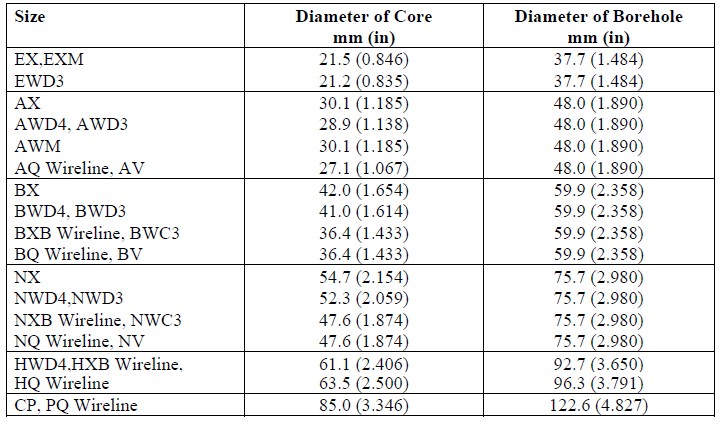
Table 1-7 lists the available core sizes. The standard size rock core, NX, has a diameter of 21/8 in (54 mm). Generally larger core sizes will lead to less mechanical breakage and yield greater recovery, but the associated cost for drilling will be much higher. Since the size of the core will affect the percent recovery, the core barrel size should be clearly recorded on the log. Additionally, the core barrel length can increase recovery in fractured and weathered rock zones. In these zones a core barrel length of 5 ft (1.5 m) is recommended. Core barrel lengths should not be greater than 10 ft (3 m) under any conditions because of the potential for damage to the long cores.
1.6.4.2 Coring Bits
The coring bit is the bottommost component of the core barrel assembly. It is the grinding action of this component that cuts the core from the rock mass. The following three basic categories of bits are in use: diamond, carbide and sawtooth (Figure 1-16).
Coring bits are generally selected by the driller and are often approved by the geotechnical specialist. Bit selection should be based on a general knowledge of drill bit performance for the expected formations and the proposed drilling fluid.
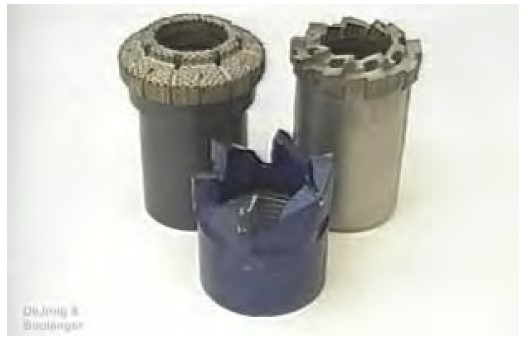
Diamond coring bits, such as surface set or impregnated-diamond types, are the most versatile since they can produce high-quality cores in soft to extremely hard rock materials (see Figure 1-10, top left). Compared to other types, diamond bits in general permit more rapid coring and, as noted by Hvorslev (1948), exert lower torsional stresses on the core. Lower torsional stresses permit the retrieval of longer cores and cores of smaller diameter. The wide variation in the hardness, abrasiveness, and degree of fracturing encountered in rock has led to the design of bits to meet specific conditions known to exist or expected to be encountered at given sites. Thus, wide variations in the quality, size, and spacing of diamonds, in the composition of the metal matrix, in the face contour, and in the type and number of waterways are found in bits of this type. Similarly, the diamond content and the composition of the metal matrix of impregnated bits are varied to meet differing rock conditions.
Carbide bits use tungsten carbide in lieu of diamonds. There are of several types of carbide bits. The standard type carbide bit is shown in Figure 1-16, top right. Bits of this type are used to core soft to medium hard rock. They are less expensive than diamond bits. However, the rate of drilling is slower than with diamond bits.
Sawtooth bits consist of teeth cut into the bottom of the bit (see Figure 1-10, bottom center). The teeth are faced and tipped with a hard metal alloy such as tungsten carbide to provide water resistance and thereby to increase the life of the bit. Although these bits are less expensive than diamond bits, they do not provide as high a rate of coring and do not have a salvage value. The saw tooth bit is used primarily to core overburden and very soft rock.
An important feature in all bits is the type of waterways provided in the bits for the passage of drilling fluid. Bits are available with so-called “conventional” waterways, which are passages cut on the interior face of the bit, or with bottom discharge waterways, which are internal passages that discharge at the bottom face of the bit behind a metal skirt separating the core from the discharge fluid. Bottom discharge bits should be used when soft rock or rock having soil-filled joints is cored to prevent erosion of the core by the drilling fluid before the core enters the core barrel.
Bit selection is based on the anticipated rock formation as well as the expected drilling fluid. Diamond bits are applicable in all rock types. They permit greater rates of coring than other types of bits. Carbide bits are less expensive than diamond bits and can be used in soft to medium-hard rock. Sawtooth bits are the least expensive of the three, however they have no salvage value. They lead to slower coring and are typically used only in soft rock.
1.6.4.3 Drilling Fluid
In many instances, clear water is used as the drilling fluid in rock coring. If drilling mud is required to stabilize collapsing holes or to seal zones when there is loss of drill water, the geotechnical specialist should be notified to confirm that the type of drilling mud is acceptable. Drilling mud will clog open joints and fractures, which adversely affects permeability measurements and piezometer installations. Drilling fluid should be contained in a settling basin to remove drill cuttings and to allow recirculation of the fluid. Generally, drilling fluids can be discharged onto the ground surface. However, special precautions or handling may be required if the material is contaminated with oil or other substances. Such fluids may require disposal off site. Water flow over the ground surface should be avoided as much as possible. Local environmental agencies should be contacted for permits because some drilling fluids may have adverse effects on local surface and subsurface environments. Certain local agencies may also require implementation of a Storm Water Pollution Prevention Plan (SWPPP).
1.6.5 Observations During Rock Core Drilling
1.6.5.1 Drilling Rate/Time
The drilling rate should be monitored and recorded on the boring log in the units of minutes per 1 ft (0.3 m). Only time spent advancing the boring should be used to determine the drilling rate.
1.6.5.2 Core Photographs
Cores in the split core barrel should be photographed immediately upon removal from the borehole. A label should be included in the photograph to identify the borehole, the depth interval and the number of the core run. It may be desirable to get a “close-up” of interesting features in the core. Wetting the surface of the recovered core by using a spray bottle and/or sponge prior to photographing will often enhance the color contrasts of the core.
A tape measure or ruler should be placed across the top or bottom edge of the core box to provide a scale in the photograph. The tape or ruler should be at least 3 ft (1 m) long, and it should have relatively large, high contrast markings to be visible in the photograph.
A color bar chart is often desirable in the photograph to provide indications of the effects of variation in film age, film processing, and the ambient light source. The photographer should strive to maintain uniform light conditions from day to day, and those lighting conditions should be compatible with the type of film selected for the project. The use of a digital camera is a convenient way to circumvent some of the problems associated with the use of film cameras for photographing rock cores.
1.6.5.3 Rock Classification
The rock type and its inherent discontinuities, joints, seams, and other facets should be documented.
1.6.5.4 Recovery
The core recovery is the length of rock core recovered from a core run. The recovery ratio is the ratio of the length of core recovered to the total length of the core drilled on a given run, expressed as either a fraction or a percentage. Core length should be measured along the core centerline. When the recovery is less than the length of the core run, the non-recovered section should be assumed to be at the end of the run unless there is reason to suspect otherwise (e.g., weathered zone, drop of rods, plugging during drilling, loss of fluid, and rolled or re-cut pieces of core). Non-recovery should be marked as NCR (no core recovery) on the boring log, and entries should not be made for bedding, fracturing, or weathering in that interval.
Recoveries greater than 100 percent may occur if core that was not recovered during a run is subsequently recovered in the next run. Recoveries greater than 100 percent should be recorded and adjustments to data should not be made in the field.
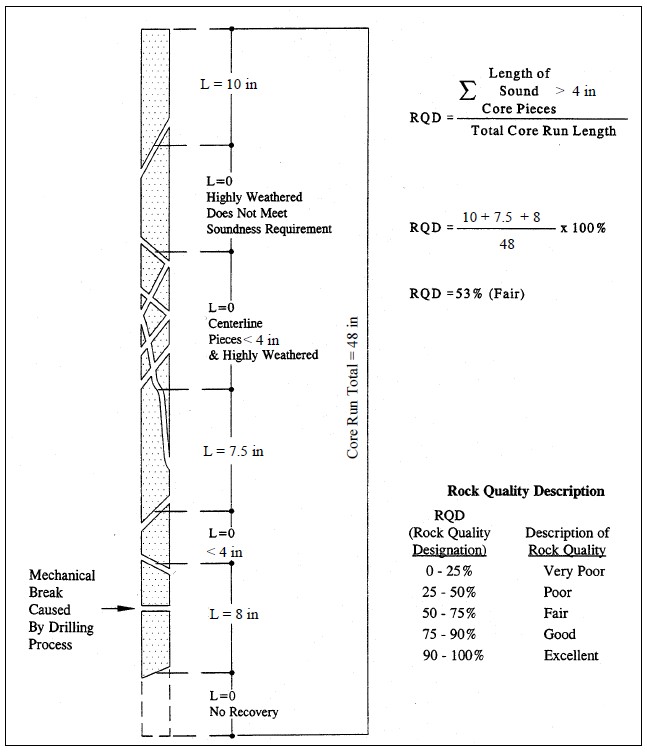
1.6.5.5 Rock Quality Designation (RQD)
The RQD is a quantitative measure that represents a modified core recovery percentage. By definition the RQD is the sum of the lengths of all pieces of sound core over 4 in (100 mm) long divided by the length of the core run (Deere, 1963). The correct procedure for measuring RQD is illustrated in Figure 1-17. The RQD is an index of rock quality. Problematic rock that is highly weathered, soft, fractured, sheared, and jointed typically yields lower RQD values than more intact rock. Thus, RQD is simply a measurement of the percentage of “good” rock recovered from an interval of a borehole.
It should be noted that the original definition of RQD reported by Deere (1963) was based on measurements made on NX-size core. Experience in recent years reported by Deere and Deere (1989) indicates that cores with diameters both slightly larger and smaller than NX may be used for computing RQD. The wire line cores using NQ, HQ, and PQ are also considered acceptable. Use of RQD for the smaller BQ and BX sizes is discouraged because of a greater potential for core breakage and loss that would result in a smaller value of RQD.
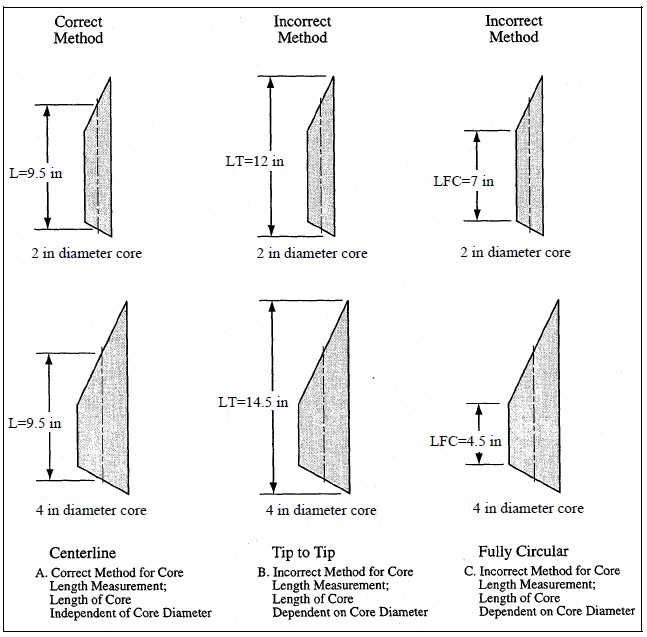
Length Measurements of Core Pieces
The same piece of core could be measured three ways: along the centerline, from tip to tip, or along the fully circular barrel section (Figure 1-18). The recommended procedure is to measure the core length along the centerline. This method is advocated by the International Society for Rock Mechanics (ISRM), Commission on Standardization of Laboratory and Field Tests (ISRM, 1981). The centerline measurement is preferred because: (1) it results in a standardized RQD not dependent on the core diameter, and (2) it avoids unduly penalizing the rock quality for cases where fractures run parallel to the borehole and are cut by a second set of fractures.
Assessment of Soundness
Pieces of core which are not “hard and sound” should not be counted for the RQD even though they possess the requisite 4 in (100 mm) length. The purpose of the soundness requirement is to downgrade the rock quality where the rock has been altered and weakened either by agents of surface weathering or by hydrothermal activity. Obviously, in many instances a judgment decision must be made as to whether or not the degree of chemical alteration is sufficient to reject the core piece.
One commonly used procedure is not to count a piece of core if there is any doubt about its meeting the soundness requirement as evidenced by discolored or bleached grains, heavy staining, pitting, or weak grain boundaries. This procedure may unduly penalize the rock quality, but it errs on the side of conservatism. A second procedure that is occasionally used includes the altered rock within the RQD summed percentage, but indicates by means of an asterisk (RQD*) that the soundness requirements have not been met. The advantage of this method is that the RQD* will provide some indication of the rock quality with respect to the degree of fracturing, while also noting its lack of soundness.
Core breaks caused by the drilling process should be fitted together and counted as one piece. Drilling breaks are usually evidenced by rough fresh surfaces. For schistose and laminated rocks, it is often difficult to discern the difference between natural breaks and drilling breaks. When in doubt about a break, it should be considered as natural in order to be conservative in the calculation of RQD for most uses. Obviously, this practice would not be conservative when the RQD is used as part of a ripping or dredging estimate.
1.6.5.6 Drilling Fluid Recovery
The loss of drilling fluid during the advancement of a boring can be indicative of the presence of open joints, fracture zones or voids in the rock mass being drilled. Therefore, the volumes of fluid losses and the intervals over which they occur should be recorded. For example, “no fluid loss” means that no fluid was lost except through spillage and filling the hole. “Partial fluid loss” means that a return was achieved, but the amount of return was significantly less than the amount being pumped in. “Complete water loss” means that no fluid returned to the surface during the pumping operation. A combination of opinions from the field personnel and the driller on this matter will result in the best estimate.
1.6.5.7 Core Handling and Labeling
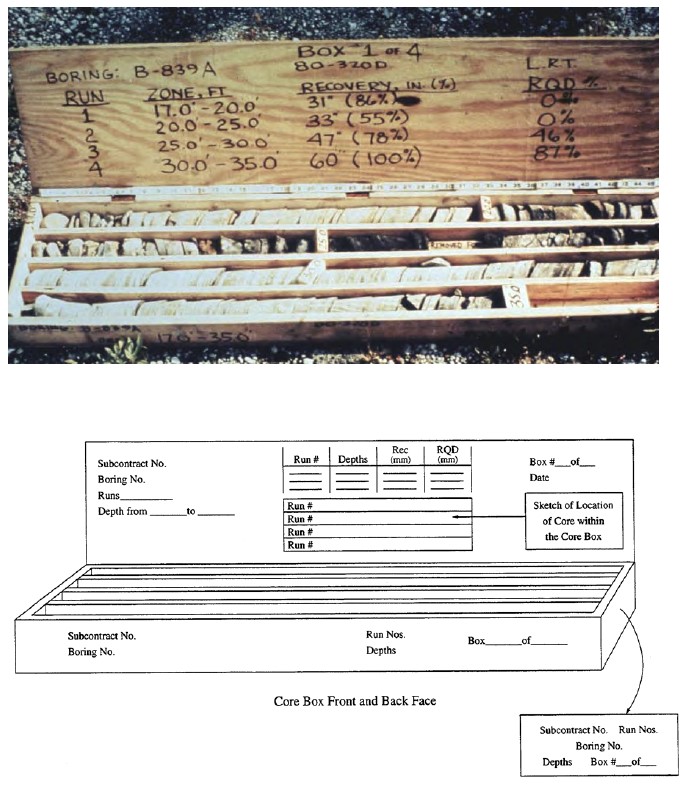
Rock cores from geotechnical explorations should be stored in structurally sound core boxes made of wood or corrugated waxed cardboard (Figure 1-19). Wooden boxes should be provided with hinged lids, with the hinges on the upper side of the box and a latch to secure the lid in a closed position.
Cores should be handled carefully during transfer from barrel to box to preserve mating across fractures and fracture-filling materials. Breaks in core that occur during or after the core is transferred to the core box should be refitted and marked with three short parallel lines across the fracture trace to indicate a mechanical break. Breaks made to fit the core into the core box and breaks made to examine an inner core surface should be marked as such. These deliberate breaks should be avoided unless absolutely necessary. Cores should be placed in the boxes from left to right, top to bottom. When the upper compartment of the box is filled, the next lower (or adjoining) compartment should be filled beginning at the left-hand side, and so on the same way until the box is filled. The depths of the top and bottom of the core and each noticeable gap in the formation should be marked by a clearly labeled wooden spacer block.
If there is less than 100 percent core recovery for a run, a cardboard tube spacer of the same length as the core loss should be placed in the core box either at the depth of core loss, if known, or at the bottom of the run. The depth of core loss, if known, or length of core loss should be marked on the spacer with a black permanent marker. The core box labels should be completed using an indelible black marking pen. An example of recommended core box markings is shown in Figure 1-19. The core box lid should have identical markings both inside and out, and both exterior ends of the box should be marked as shown in Figure 1-19. For angled borings, depths marked on core boxes and boring logs should be those measured along the axis of the boring. The angle and orientation of the boring should be noted on the core box and the boring log.
1.6.5.8 Care and Preservation of Rock Samples
A detailed discussion of sample preservation and transportation is presented in ASTM D 5079. Four levels of sample protection are identified as follows:
a) routine care,
b) special care,
c) soil-like care, and
d) critical care.
Routine care in placing rock core in core boxes will be used for most geotechnical explorations. ASTM D 5079 suggests enclosing the core in a loose-fitting polyethylene sleeve prior to placing the core in the core box.
Special care is considered appropriate if the moisture state of the rock core (especially shale, claystone and siltstone) and the corresponding properties of the core may be affected by exposure. Special care can also be applied if it is important to maintain fluids other than water in the sample. Critical care is needed to protect samples against shock and vibration or variations in temperature, or both. For soil-like care, samples should be treated as indicated in ASTM D 4220.
1.6.6 Geologic Mapping
Geologic mapping is the systematic collection of local, detailed geologic data, and, for engineering purposes, is used to characterize and document the condition of a rock mass or outcrop. The data derived from geologic mapping are a portion of the data required for the design of a cut slope or for the stabilization of an existing slope. Geologic mapping can often provide more extensive and less costly information than drilling. Soil and soil-like materials, although occasionally mapped, are not considered in this section. For a detailed discussion of geologic mapping, the reader is referred to the FHWA manual on rock slopes (FHWA, 1998a).
1.7 Standard Penetration Test (SPT)
The standard penetration test (SPT) is performed during the advancement of a soil boring to obtain a disturbed drive sample (split barrel type) of the soil being penetrated and an approximate measure of its dynamic resistance. The test was introduced by the Raymond Pile Company in 1902 and remains today as the most common in-situ test performed worldwide. The procedures for the SPT are detailed in ASTM D 1586 and AASHTO T 206. A summary of the important features of the test follows.
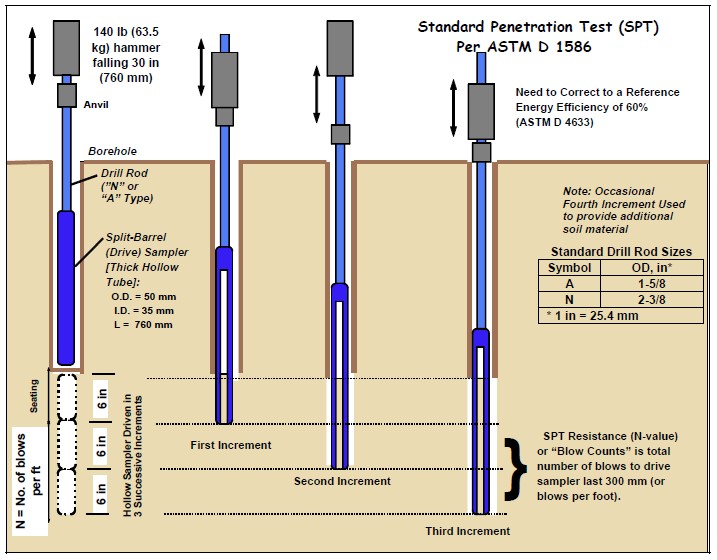
The SPT involves the driving of a hollow thick-walled tube into the ground and measuring the number of blows to advance the split-barrel sampler having standard dimensions of 2 in (50 mm) outside diameter (OD) and 1-3/8 in (35 mm) inside diameter (ID) a vertical distance of 1 ft (300 mm), see Figure 1-20. A 140 pound (63.5 kilogram) hammer is repeatedly dropped from a height of 30 in (0.76 m) to achieve three successive 6 in (150 mm) increments of penetration. The first recorded increment is considered as a “seating” penetration, while the number of blows to advance the second and third increments are summed to give the N-value (“blow count”) or SPT-resistance (reported in blows per foot (0.3 m)).
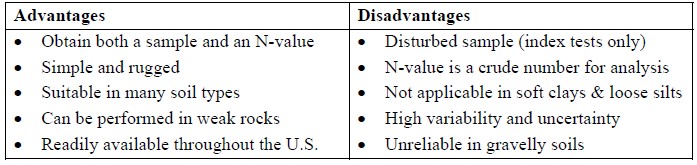
The SPT can be halted when a total of 100 blows have been counted or if the number of blows exceeds 50 in any given 6 in (150 mm) increment, or if the sampler fails to advance during 10 consecutive blows. SPT refusal is defined by penetration resistances exceeding 100 blows per 2 in (50 mm), although ASTM D 1586 has re-defined this limit at 50 blows per 1 in (25 mm). If bedrock, or an obstacle such as a boulder, is encountered, the boring may be advanced further by using diamond core drilling or non-core rotary methods (ASTM D 2113; AASHTO T 225) at the discretion of the geotechnical specialist. In certain cases, this SPT criterion may be utilized to define the top of bedrock within a particular geologic setting where boulders are not of concern or not of great impact on the project requirements. The advantages and disadvantages of the SPT are listed in Table 1-8.
The SPT is conducted at the bottom of a soil boring that has been advanced by use of either flight augers or rotary wash drilling methods. The borehole can be cased or uncased. At regular depth intervals, the drilling process is interrupted to perform the SPT. Generally, at depths shallower than 10 ft (3 m) the SPT is performed continuously or at intervals of 2.5 ft (0.75 m). Below a depth of 10 ft (3 m) the SPT is generally performed at intervals of 5 ft (1.5 m) to the planned end of the boring or refusal. If the borehole extends below the groundwater table, the head of water in the borehole must be maintained at or above the ambient groundwater level to avoid inflow of water and borehole instability.
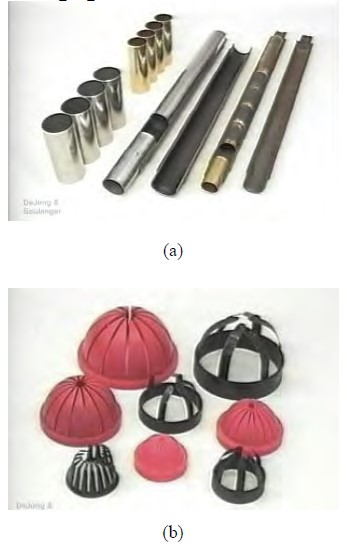
Liners may be placed inside the split-barrel sampler with the same inside diameter as the cutting shoe, see Figure 1-21a. This allows samples to remain intact during transport to the laboratory. The liners may be arranged in a set of 1-inch (25 mm) high rings in which case “ring” samples of pre-determined height may be obtained. In U.S. practice, it is normal to omit the liner. The resistance of the sampler to driving is altered depending upon whether or not a liner is used (Skempton 1986, Kulhawy and Mayne, 1990). Therefore, when the liners are used, their use should be clearly mentioned in the boring logs.
Steel or plastic sampler “catchers” are often required to keep samples of clean granular soils in the split-barrel sampler. Figure 1-21 shows a variety of catchers. They are inserted inside the sampler between the cutting shoe and the sample barrel to help retain loose or flowing materials. These catchers permit the soil to enter the sampler during driving but upon withdrawal they close and thereby retain the sample. Use of sample catchers should be noted on the boring log.
1.7.1 Energy Efficiency of Hammers
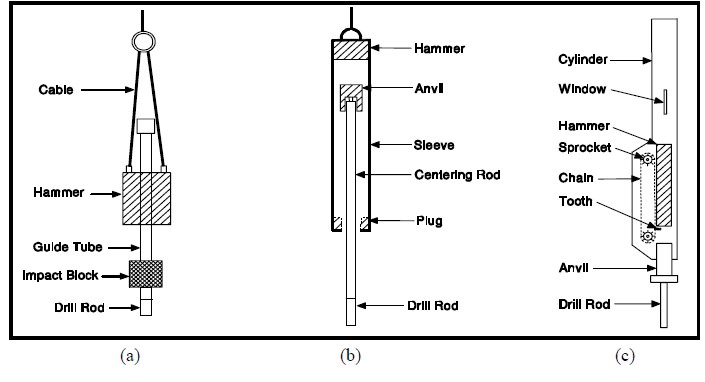
In current U.S. practice, three types of drop hammers and four types of drill rods are used in performing the SPT. Drop hammer types are typically donut, safety, and automatic (see Figure 1-22). Typical drill rod sizes are N or A (see Figure 1-20 for sizes). The test results are highly dependent upon the type of equipment used and the experience of the operator performing the test. One of the more important factors for obtaining useful data from the test is the energy efficiency of the system. The theoretical energy of a free-fall system with the specified mass and drop height is 350 ft-lb (48 kg-m), but the actual energy is less due to a number of factors including frictional losses and eccentric loading that are specific to the hammer drop. The energy efficiency of the rotating cathead and rope system commonly used in the past depends on numerous factors including: type of hammer, number of rope turns, conditions of the sheaves and rotating cathead (e.g., lubricated, rusted, bent, new, old), age of the rope, actual drop height, vertical plumbness, weather and moisture conditions (e.g., wet, dry, freezing), and other variables (see for example Skempton, 1986). In the recent past the trend has been towards the use of automated systems for lifting and dropping the mass in order to minimize these factors. Automated systems provide more reliable and more reproducible results than the rotating cathead and rope system used in the past.
A calibration of energy efficiency for a specific drill rig and operator is recommended by ASTM D 4633. Instrumented strain gages and accelerometer measurements are used for these calibrations in an attempt to standardize the energy levels. The standard of practice for energy efficiency varies from about 35% to 85% with cathead systems using donut or safety hammers. The average for cathead systems in the United States is approximately 60%. The newer automatic trip-hammers can deliver between 80 to 100% efficiency, depending upon the type of commercial system being used.
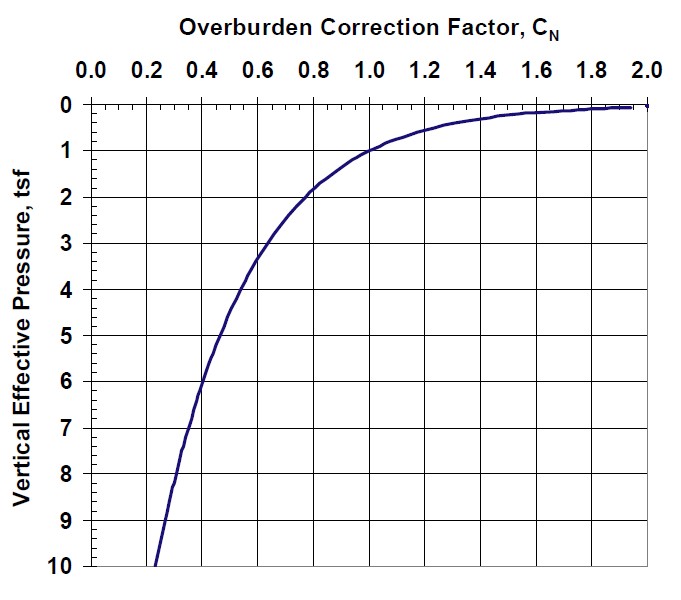
If energy efficiency (Ef) is measured, then the energy-corrected SPT N-value adjusted to 60% efficiency (N60) is given by:
where Nmeas is the N-value measured in the field during the test. N-values measured in the field should be corrected to N60 for all soils, if possible. The relative magnitudes of corrections for energy efficiency, sampler lining, rod lengths, and borehole diameter are given by Skempton (1986) and Kulhawy and Mayne (1990), but only as general guidelines. Theoretically it is mandatory to measure Ef to get the proper correction to N60. In absence of data, AASHTO (2004 with 2006 Interims) recommends Ef = 60 for rope and cathead systems, i.e., donut and safety hammers and Ef = 80 for automatic hammer systems.
The efficiency may be obtained by comparing either the work done (W = F.d = force times displacement) or the kinetic energy (KE = ½mv2) with the potential energy of the system (PE = mgh), where m = mass, v = impact velocity, g = 32.2 ft/s2 = 9.8 m/s2= gravitational constant, and h = drop height. Thus, the energy ratio (ER) is defined as W/PE, or ER = KE/PE. It is important to note that geotechnical foundation practice and engineering usage based on SPT correlations have been developed on the basis of the standard-of-practice, corresponding to an average ER ≈ 60 %. Thus, it is recommended to adjust measured N-values (Nmeas) to N60 values.
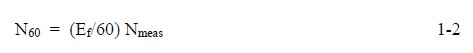
Figure 1-23 exemplifies the need for correcting measured N-values to a reference energy level where the successive SPTs were conducted by alternating the use of donut and safety hammers in the same borehole. The energy ratios were measured for each test and gave 34 < ER < 56 for the donut hammer (average = 45%) and 55 < ER < 69 for the safety hammer (average = 60%) at this site. The individual trends for the measured N-values from donut and safety hammers are quite apparent in Figure 3-23(a), whereas a consistent profile is obtained in Figure 3-23(b) once the data have been corrected to ER = 60%.
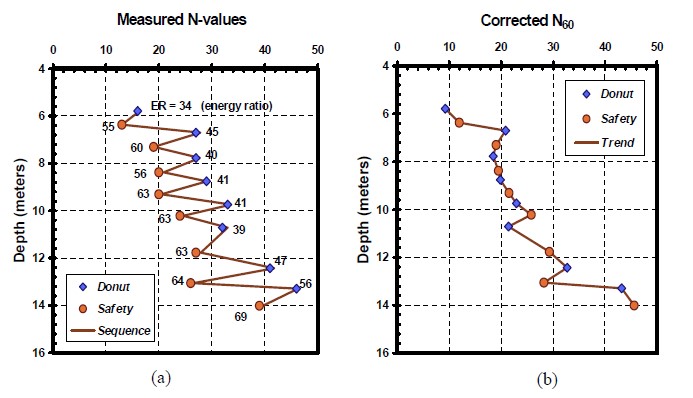
1.7.2 Effect of Overburden Stress on N-values Since N-values of similar materials increase with increasing effective overburden stress, the corrected blow count (N60) is often normalized to 1-atmosphere (1 tsf or about 100 kPa) effective overburden stress by using overburden normalization schemes. The energy-corrected blow count normalized for overburden is referred to as N160, and is equal to:

where CN is the overburden correction factor (or stress normalization parameter) calculated as (Peck, et al., 1974):
CN = [0.77 log10 (20/po)], and CN < 2.0
po = vertical effective pressure at the depth where the SPT test is performed (tsf)
N60 = SPT blow count corrected for hammer efficiency (blows/ft) – refer to Equation 1-2.
Note that the constants in Equation 1-3 are unit dependent therefore the units of po must be tsf. Figure 3-24 presents the overburden correction factor as a function of vertical effective stress.
Caution should be exercised in applying the overburden correction factor to indurated cemented soils, e.g., hard caliche soils encountered in the desert southwest. In such soils, the overburden pressure may not be a direct function of the depth of the soil. Therefore, the overburden correction is not recommended for such soils since it may lead to overly conservative designs.
1.7.3 Correlation of SPT N-Values with Basic Soil Characteristics
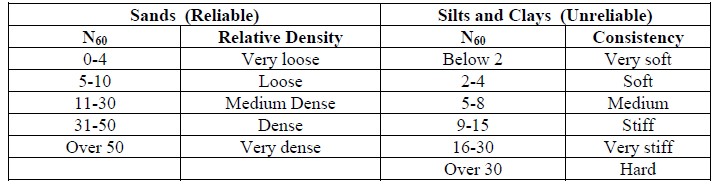
SPT N-values are an indication of the relative density of cohesionless soils and the consistency of cohesive soil. Table 1-9 shows N-value ranges correlated to the relative density of sands and the consistency of fine-grained soils. It is emphasized that these correlations are unreliable for gravels, silts and clays and should serve only as crude estimates for these materials.
1.7.3.1 Applicability of SPTs in Gravelly Soils
The SPT can be performed in a wide variety of soil types as well as weak rocks, however the SPT is not particularly useful in the characterization of gravelly soils. Since the split-spoon inside diameter is 1-⅜ in (35 mm), gravel sizes larger than 1-⅜ in (35 mm) will not enter the spoon. Therefore, soil descriptions may not reflect actual gravel content of the deposit. Also, gravel pieces may plug the end of the spoon and cause the SPT blow count to be erroneously large. Thus, the SPT in such cases produces refusal blow counts (i.e., > 50 blows per 1 in (25 mm)) that are misleading and lead to unconservative designs. In this case, “Large Penetration Tests” (LPTs), such as the Becker Penetration Test (BPT), are more suitable. The LPTs consist of driving a pipe (casing) larger than the standard split spoon sampler into the ground with a pile-driving hammer. While the pipe is being driven, the driving resistance or blow count/ft of penetration is recorded. Unlike the SPT, the LPT blow count is non-standardized and is a function of the drill rod size, pipe (sampler) size, hammer type, and hammer efficiency. Careful energy calibrations are required to correlate the LPT blow counts to SPT N-values However, this effort may be worthwhile considering that the results of SPT in gravelly soils are unreliable and misleading. Daniel, et al. (2003) present methods for evaluating LPT blow counts.
Since the gravel content cannot be measured by the SPT, it is recommended that consideration be given to obtaining bulk samples by drilling large diameter borings with augers similar to the one shown in Figure 1-5a. The bulk samples obtained from such borings will also help evaluate whether the soil deposit is indeed a gravel deposit or gravels are larger particles floating in a softer soil matrix. The bulk samples will also permit an accurate determination of the Unified Soil Classification System (USCS) designation, which will be useful from design as well as constructability considerations.
1.7.4 SPT Test Errors
Although the procedures for conducting the SPT test have been standardized, several errors can creep into the test. The most common errors are:
- Effect of overburden pressure. Soils of the same density will give smaller blow counts near the ground surface. The overburden stress normalization parameter (CN) can be used to correct for this factor.
- Variations in the 30 in (770 mm) free fall of the drive weight. The drop height is often gauged by eye with the older rotating cathead and rope system Newer hammer systems automatically release the weight at a height of 30 inches. The energy correction factor accounts for this factor.
- Interference with the free fall of the drive weight by the guides or the hoist rope required in the rotating cathead and rope system. Newer automatic hammer systems eliminate rope interference. The energy correction factor accounts for this factor.
- Use of a drive shoe that is damaged or worn from too many “refusal” blow counts (Nmeas ≥ 100 blows/foot).
- Failure to seat the sampler properly on undisturbed material in the bottom of the boring.
- Inadequate cleaning of loosened material (slough) from the bottom of the boring.
- Failure to maintain sufficient hydrostatic pressure in the borehole during drilling below the groundwater table. Unbalanced hydrostatic pressures between the borehole drill water and the groundwater table can cause the test zone to become “quick.” This can happen when a continuous-flight auger is used with the end plugged and with a water level in the hollow stem below that in the hole.
- Effect of gravel size as discussed in Section 1.7.3.1.
- Samples retrieved from dilatant soils (fine sands, sandy silts) that exhibit unusually highblow counts should be examined in the field to determine if the sampler drive shoe is plugged. Poor sample recovery is usually an indication of plugging.
- Careless work on the part of the drill crew.
The use of qualified and experienced drillers cannot be overemphasized. Agencies that maintain their own drilling personnel and equipment generally achieve much more reliable and consistent results than those that routinely let boring contracts to the lowest bidder.
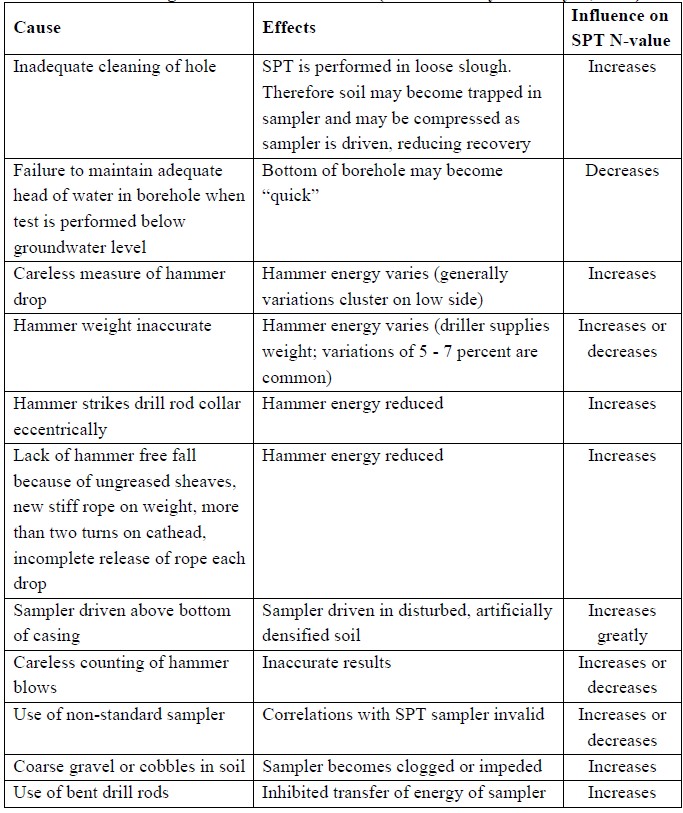
Soil type, density, and overburden pressure are the most significant factors affecting SPT N- values (assuming good workmanship and equipment). Table 1-10 lists factors affecting the SPT and SPT results.
Regardless of the impressive list of shortcomings, the SPT is not likely to be abandoned for several reasons:
- The test is very economical in terms of cost per unit of information.
- The test results provides soil samples, which can be tested for index properties and visually examined.
- Long service life of the enormous amount of equipment in use.
- The accumulation of a large SPT database that is continually expanding.
- The results of the SPT have been correlated with a number of soil properties to provide estimates of the values of those properties. The estimated values are often used for preliminary designs in lieu of values obtained from tests run specifically to determine those properties.
- The fact that other methods can be readily used to supplement the SPT when the borings indicate more refinement in sample/data collection.
1.8 Log of Borehole Information (“Boring Logs”)
The importance of accurate field notes and good logging of boreholes cannot be overemphasized. The logger must realize that a good field description must be recorded. The field-boring log is the major portion of the factual data used in the analysis of foundation conditions.
The boring log is a record that should contain all of the information obtained from a boring whether or not it may seem important at the time of drilling. It is important to record the maximum amount of information accurately. This record is the “field” boring log, as opposed to the “finished” boring log used in the preparation of the geotechnical data report. The finished log is drawn from the data presented in the field log supplemented by the results of visual identifications of samples and classification tests made in the laboratory. A typical boring log form is shown on Figures 1-25. The form presented in Figures 1-25 can be used for recording field data as well.
1.8.1 Boring Log Format
A wide variety of boring log forms are used by various agencies. The specific log to be used for a given type of boring will depend on local practice. The log in Figures 1-25 is just one example of a log used by geotechnical specialists. For detailed information on boring logs, the reader can refer to FHWA (1997, 2002b). The boring log shown in Figures 1-25 is used in this document simply to present the reader with an idea of the basic information that should be included in a boring log. Specific projects will likely require more detailed logs. Often separate logs are used for logging information from borings in soils and rocks unlike the log shown in Figures 1-25, which combines this information.
1.8.2 Duties of the Logger
The technical background and experience of the person who logs the field information will vary by organization. Some organizations will have a geotechnical engineer, an engineering geologist, a geologist, or a trained technician to accompany the drill crew, while others may train the drill crew foreman to log the borehole. In order to obtain the maximum amount of accurate data, the logger should work closely with the driller and be alert for changes in materials and operations while drilling is being performed. The logger is generally responsible for recording the following basic information on the field boring log:
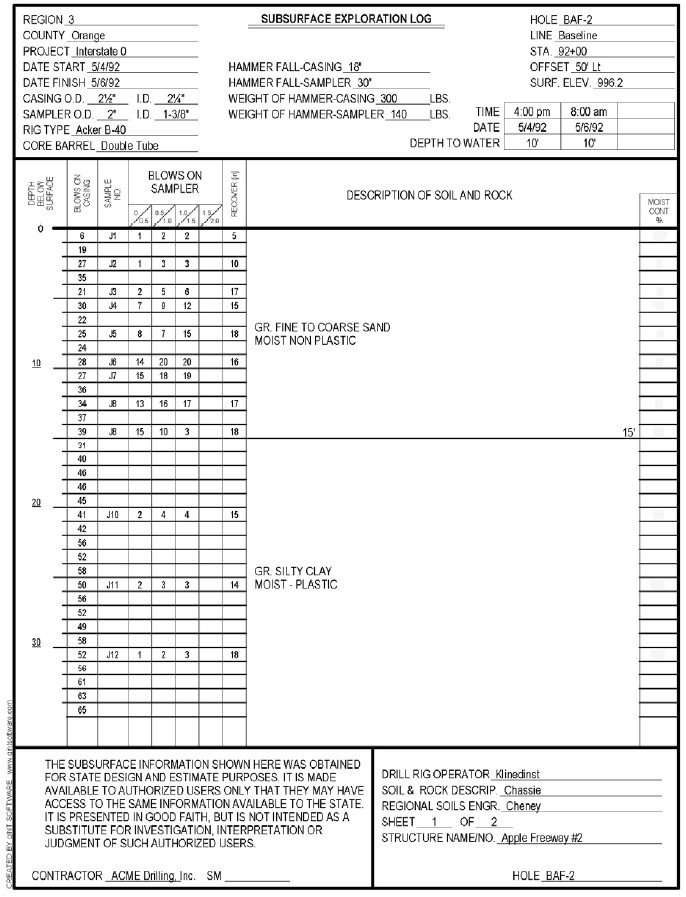
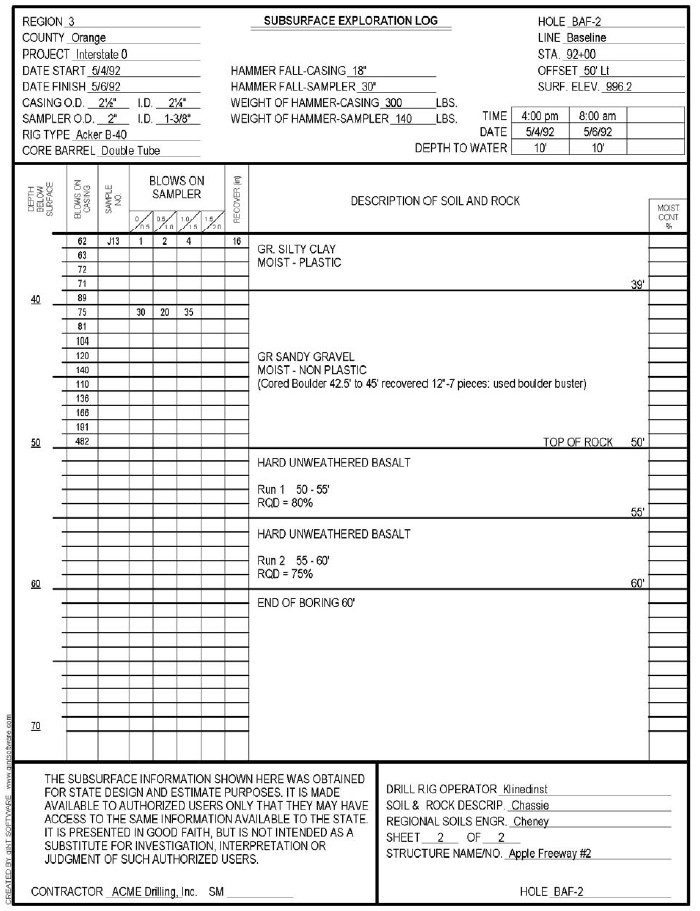
- General description of each soil and rock stratum, and the depth to the top and bottom of each stratum. As noted before, the log demonstrated in Figure 1-25 is intended to be a field log. On the final log, the description of the soil should be much more detailed and follow a specified soil classification system. Soils in the geotechnical engineering community are most often classified according to the Unified Soil Classification System (USCS). For example, the soils between depths 15 ft to 39 ft have been simply described in the field as “GR. SILTY CLAY, MOIST-PLASTIC.” Soft, wet, gray, high plasticity CLAY, with Silt; Fat CLAY (CH); (Alluvium)
- The depth to groundwater at the time it is first encountered and afterwards at the end of each day, at completion of boring, and, if possible, at least 24 hours after completion of the boring.
- The depth at which each sample is taken, the type of sample taken, its number, and any loss of samples taken during extraction from the hole.
- The depths at which field tests are made and the results of the test.
- Information generally required by the log format, such as:
- Boring number and location.
- Date of start and finish of the hole.
- Name of driller (and of logger, if applicable).
- Elevation at top of hole.
- Depth of hole and reason for termination.
- Diameter of any casing used.
- Size of hammer and free fall used on casing (if driven).
- Blows per foot to advance casing (if driven).
- Description and size of sampler.
- Size of drive hammer and free fall used on sampler in dynamic field tests.
- Blow count for each 6 in (150 mm) to drive sampler. (Sampler should be driven three 6 in (150 mm) increments or to a total of 100 blows).
- Type of drilling rig used.
- Type and size of core barrel used.
- Length of time to drill each core run or foot of core run.
- Length of each core run and amount of core per run.
- Recovery of sample in inches and RQD of rock core.
- Project identification.
- Notes regarding any other pertinent information and remarks on miscellaneous conditions encountered, such as:
- Depth of observed groundwater, elapsed time from completion of drilling, conditions under which observations were made, and comparison with the elevation noted during reconnaissance (if any).
- Artesian water pressure.
- Obstructions encountered.
- Difficulties in drilling (caving, coring boulders, surging or rise of sands in casing, caverns, etc.).
- Loss of circulating water and addition of extra drilling water.
- Drilling mud and casing as needed and why.
- Odor of recovered sample.
- Sampler plugged.
- Poor recovery.
- Any other information the collection of which may be required by agency policy (e.g., names and associations of visitors to the site, etc.).
1.9 Cone Penetration Testing (CPT)
The history of field cone penetrometers began with a design by the Netherlands Department of Public Works in 1930. This “Dutch” cone penetrometer was a mechanical operation using a manometer to read loads. Paired sets of inner and outer rods are pushed into the ground in 8 in (200 mm) intervals. In 1948, electric cones permitted continuous measurements to be taken downhole. In 1965, the addition of sleeve friction measurement devices allowed an indirect means for identifying soil types. Later, in 1974, the electric cone was combined with a piezoprobe to form the first piezocone penetrometer. Most recently, additional sensors have been added to form specialized devices such as the resistivity cone, acoustic cone, seismic cone, vibrocone, cone pressuremeter, and lateral stress cone.
The cone penetration test (CPT) was first introduced in the U.S. in 1965. Since that time, the CPT has developed into one of the most popular in-situ testing methods because it is fast, economical, and provides continuous profiling of the geostratigraphy and allows for continuous in-situ evaluation of soil properties. Depending upon equipment capability as well as soil conditions, 330 to 1150 ft (100 to 350 m) of penetration testing may be completed in one day.
As shown in Figure 1-26, the CPT involves the hydraulic push of an instrumented steel probe into the soil at a constant rate to obtain continuous vertical profiles of stresses and/or other measurements. No borehole, cuttings, or spoil are produced by this test. Testing is conducted in accordance with ASTM D 5778.
The CPT can be used in very soft clays to dense sands. It is not suitable for use in highly indurated or cemented soils or in soils containing significant amounts of gravel and boulders. The advantages and disadvantages of the CPT are listed in Table 1-11.
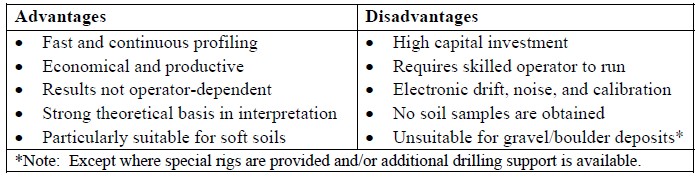
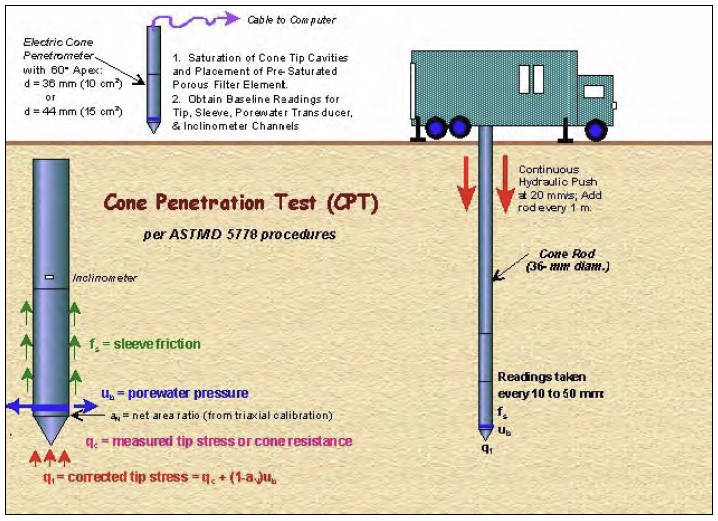
Although the test provides continuous logging of the in-situ response of the soil, which can lead to more accurate and reliable analyses, no soil samples are available for laboratory testing. For that reason the CPT provides an excellent complement to the more conventional soil test boring with SPT measurements and subsequent laboratory testing on retrieved samples.
1.9.1 Equipment Description and Operation
Electronic cones are now the dominant cone type used in cone penetration testing. Therefore, mechanical cones are not discussed in this document. Electronic cones may be further divided into three primary types: (a) the standard friction cone (CPT), (b) the piezocone (PCPT or more commonly CPTu), and (c) the seismic cone piezo-cone (SCPTu). Each of these cones is briefly described here. To assist in following the brief descriptions, the standard terminology regarding the cone penetrometer is shown in Figure 1-27.
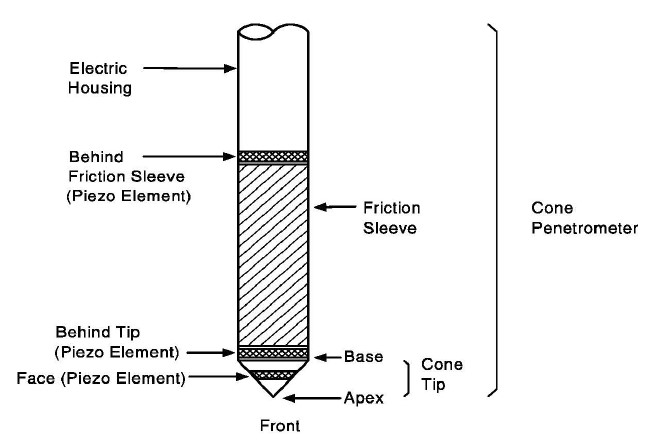
1.9.2 The Standard Cone Penetration Test (CPT)
The equipment necessary for performing a standard CPT includes a penetrometer, cone rod or drill rod, an electrical cable, a data acquisition system, and a hydraulic actuator attached to equipment that has sufficient reaction mass to advance the penetrometer. The equipment that provides the reaction mass can be a conventional drilling rig, however, a dedicated CPT truck commonly weighing 20 to 25 tons (200 to 250 kN) is more commonly used. A standard cone penetrometer is a 1.4 in (35.7 mm) diameter cylindrical probe with a 60o conical apex at the tip. The tip has a projected area of 1.6 in2 (10 cm2). The surface area of the sleeve above the cone is 23.3 in2 (150 cm2). More robust penetrometers are available with a 1.7 in (44 mm) diameter body, a 2.3 in2 (15 cm2) projected tip area, and a 31 to 35 in2 (200 to 225 cm2) sleeve surface area. A penetrometer having a projected cone area of 2.3 in2 (15 cm2) will generally provide the same response as one having a projected cone area of 1.6 in2 (10 cm2). The “size” of a cone is defined by its projected tip area, e.g. a 1.6 in2 (10 cm2) cone or a 2.3 in2 (15 cm2) cone. Figure 1-28 shows a number of different cone penetrometers and piezocones.
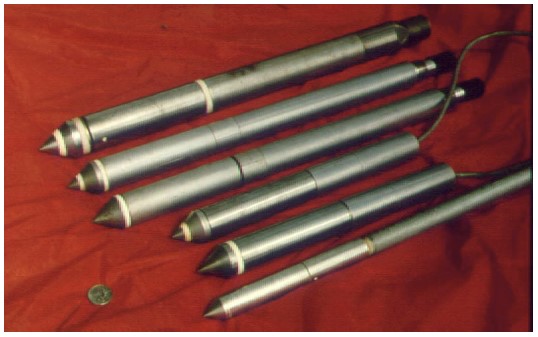
A section of standard cone rod is typically 3.3 ft (1 m) in length with a 1.4 in (35.7 mm) outer diameter and a 0.9 in (22 mm) inner diameter. Alternatively, the penetrometer can be pushed with standard AW drill rod (1¾ in (44.4 mm) OD; 1¼ in (31.8mm) ID) or EW drill rod (1⅜ in (34.9 mm) OD; 15/16 in (23.8 mm) ID).
The cone cable runs through the hollow cone/drill rods and attaches to an electronic data acquisition system at the ground surface. The data acquisition system generally consists of an analog signal conditioner, an analog to digital (A-D) converter, and a computer processor. Current data acquisition systems are attached to one or two computer monitors so the operator and engineer can observe data recorded during the sounding in real time. Real time monitoring allows for decisions to be made in the field with respect to the sounding. This is helpful if auxiliary tests, such as a pore pressure dissipation test, are to be performed in certain soil layers, or if the test is to be terminated once a certain layer is encountered. Printers can be attached to the computer processor to obtain a real-time printout of the data. Printed data are a good backup in case an unforeseen incident causes the computer to crash resulting in the loss of the electronically stored data. Data are typically recorded every ¾ to 2 in (20 to 50 mm) of vertical penetration.
The test procedure for the standard cone penetration test and the nature of the data acquired during the test are described in Sections 3.9.5 and 3.9.6, respectively.
1.9.3 The Piezo-cone Penetration Test (CPTu)
The piezo-cone (CPTu) is essentially the same as the standard electronic friction cone except that it includes porous filter piezo-elements that may be located at the cone tip, on the cone face, behind the cone tip, or behind the friction sleeve. These porous filter elements are used to measure pore water pressure during penetration. Saturation of the porous element and cavity is essential to obtain reliable pore water pressure measurements.
1.9.4 The Seismic Piezocone Penetration Test (SCPTu)
For the seismic piezocone test (SCPTu), a geophone is located approximately 1.6 feet (500 millimeters) uphole from the cone tip. The geophone detects shear waves generated at the ground surface at intervals of approximately 3 or 5 ft (1 or 1.5 m), corresponding to successive rod additions. If necessary, adjustments should be made if AW or EW rods are used to advance the cone since they typically come in longer lengths.
1.9.5 Test Procedures
The test procedure for the CPT consists of hydraulically pushing the cone at a rate of 0.8 in/s (20 mm/s) in accordance with ASTM D 5778 by using either a standard drill rig or a specialized cone truck as the reaction mass (see Figure 1-29). The advance of the probe requires the successive addition of rods at approximately 3 or 5 ft (1 or 1.5 m) intervals. Readings of tip resistance (qt), sleeve friction (fs), inclination (i), and pore water pressure (um) are taken at least every 2 in (50 mm) (i.e., at approximately 2.5-sec intervals). For the seismic cone test, shear wave arrival times (ts) are typically recorded at rod breaks corresponding to 3 or 5 ft (1 or 1.5 m) intervals.
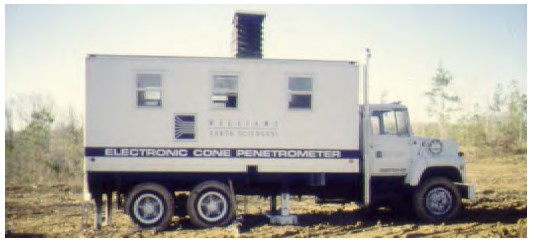
1.9.6 CPT Profiles
The results of the individual channels of a piezocone penetration test are plotted with depth, as illustrated in a typical plot shown in Figure 1-30. Since soil samples are not obtained with the CPT, an indirect assessment of Soil Behavioral Type (SBT) is inferred by an examination of the readings. The numbers can be processed for use in empirical chart classification systems, or the raw readings can be easily interpreted for soil strata changes. A simplified soil classification chart for a standard electric friction cone is presented in Figure 1-31. The sleeve friction, often expressed in terms of a friction ratio Rf = fs/qt, also is a general indicator of soil type. For example, in sands, usually 0.5% < Rf < 1.5 %; and in clays, normally 3% < Rf < 10%. In the lower half of the Figure 1-31, the center column shows an approximate relationship between the SPT N-value and the cone tip resistance, qc. The SPT N-value obtained from this relationship should be considered to be equivalent to N160.
1.9.7 CPT Profile Interpretation
The CPT sounding shown in Figure 1-30 was taken in the immediate vicinity of the boring recorded in the boring log shown in Figures 1-25. These two logs permit an interesting comparison to be made of the SPT and CPT procedures. In the sounding shown in Figure 330, a clayey and sandy stratum (clay, clayey silt, silt, silty sand and sandy silt) occurs from the ground surface to a depth of 10 ft (3 m). These strata are underlain by a thick layer of sand and sandy silt to depth of approximately 20 ft (6 m), which in turn is underlain by a clay layer extending down to a depth of approximately 45 ft (14 m). Finally, a dense gravelly sand layer is encountered, which the cone penetrometer could not penetrate. The SPT tests could however be performed in this dense layer since it was possible to drill into this layer.
Figure 1-30 is a good example that demonstrates the advantage of continuous sounding compared to the samples obtained at discrete intervals using SPT procedures. For example, depending on the sampling interval in the SPT test, the silt layer within the clay layer may not have been undetected. Even if it had been detected, it would not have been possible to estimate its thickness accurately between the locations of the SPT samples because the SPT samples are commonly retrieved at 5 ft (1.5 m) intervals. The implications of this shortcoming can be significant in design. For example, silt consolidates faster than clay. If the designer is not aware of the silt layer, then he/she might design a wick drain surcharge system that, based on a clay layer 25 ft (7.5 m) thick, will take longer to consolidate than what might actually be the case. In fact, the CPT profile in Figure 1-30 shows that only the 15 ft (4.5 m) portion of the clay layer below the silt layer has excess pore pressures, which suggests that it will be the primary source of consolidation settlements.
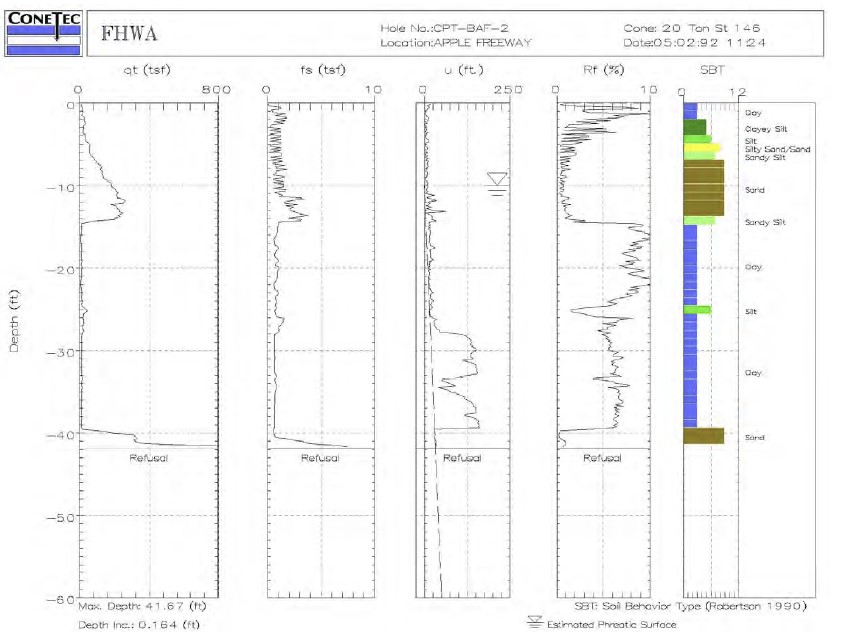
It is important for the reader to understand that CPT procedures do not allow retrieval of physical samples that can be tested in the laboratory to characterize various phenomena such as consolidation and shear strength. Thus, it is most beneficial to use the CPT with another method, such as the boring technique used in the SPT, that allows the retrieval of physical samples for laboratory testing. Performing the CPT before sampling in borings will permit identification of the specific depths where disturbed and undisturbed physical samples should be obtained for laboratory tests.
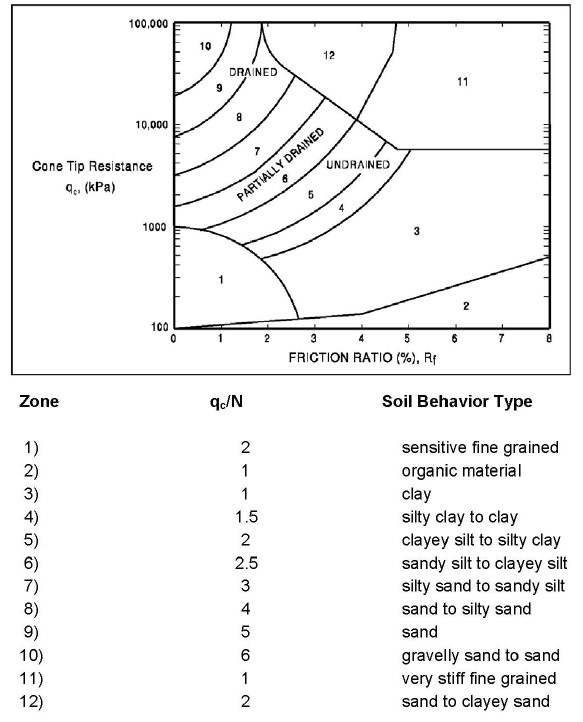
1.10 Dilatometer Test (DMT)
The dilatometer is an in-situ testing device that was developed in Italy in the early 1970s and first introduced in the U.S. in 1979. Like the cone penetrometer, the dilatometer is generally hydraulically pushed into the ground although it may also be driven. When the dilatometer can be pushed into the ground with tests conducted at 8 in (200 mm) increments, 100 to 130 ft (30 to 40 m) of soundings may be completed in a day. The primary utilization of the dilatometer test (DMT) in pile foundation design is the delineation of subsurface stratigraphy and interpreted soil properties. However, it would appear that the CPT/CPTu is generally better suited to this task than the DMT. The DMT may be a potentially useful test for the design of piles subjected to lateral loads. Design methods in this area show promise, but are still in the development stage. For design of axially loaded piles, the DMT has limited direct value. A picture of the DMT equipment is presented in Figure 1-32.
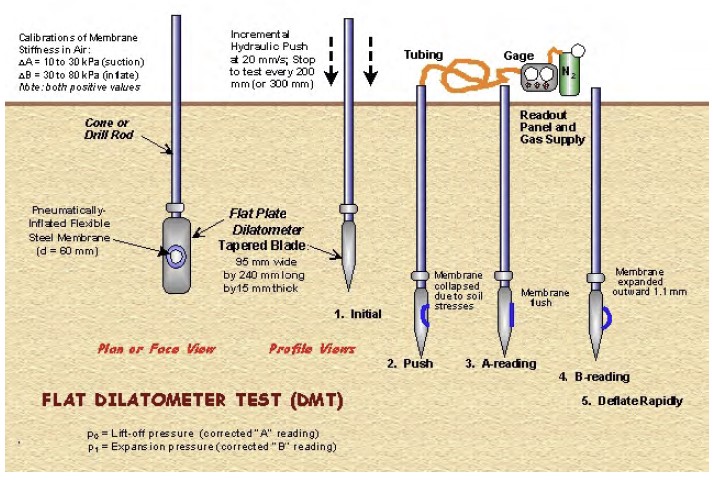
1.11 PRESSUREMETER TEST (PMT)
The pressuremeter is an in-situ device used to evaluate soil and rock properties. The pressuremeter has been used in Europe for many years and was introduced into the U.S. in the mid 1970s. The pressuremeter imparts lateral pressures to the soil, and the soil shear strength and compressibility are determined by interpretation of a pressure-volume relationship. The pressuremeter test (PMT) allows a determination of the load-deformation characteristics of soil in axisymmetric conditions. Deposits such as soft clays, fissured clays, sands, gravels and soft rock can be tested with pressuremeters. A pressuremeter test produces information on the elastic modulus of the soil as well as the at rest horizontal earth pressure, the creep pressure, and the soil limit pressure. A schematic of the pressuremeter test is presented in Figure 1-33.
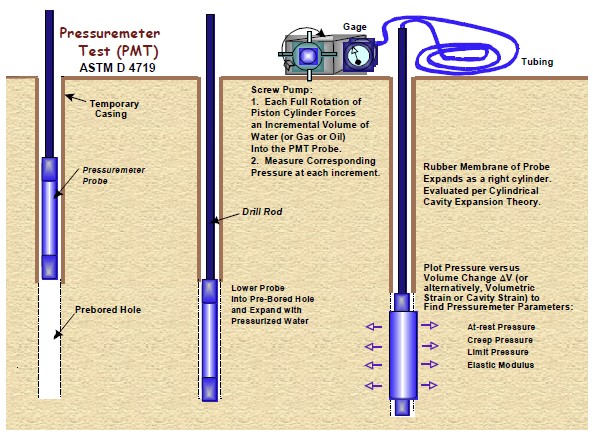
1.12 VANE SHEAR TEST (VST)
The vane shear test is an in-situ test for determining the undrained shear strength of soft to medium clays. Figure 1-34 is a schematic drawing of the essential components and test procedure. The test consists of forcing a four-bladed vane into undisturbed soil and rotating it until the soil shears. Two shear strengths are usually recorded, the peak shearing strength and the remolded shearing strength. These measurements are used to determine the sensitivity of clay, which is defined as the ratio of the peak undrained shearing strength to the remolded undrained shearing strength. Sensitivity, St, allows analysis of the soil resistance to be overcome during pile driving in clays which is useful for pile driveability analyses. It is necessary to measure skin friction along the steel connector rods which must be subtracted to determine the actual shear strength. The VST generally provides the most accurate undrained shear strength values for clays with undrained shear strengths less than 1 ksf (50 kPa). The test procedure has been standardized in AASHTO T 223-74 and ASTM D 2573.
It should be noted that the sensitivity of a clay determined from a vane shear test provides insight into the set-up potential of the clay deposit. However, the sensitivity value is a qualitative and not a quantitative indicator of soil set-up. Classification of clayey soils based on sensitivity values is presented in Table 1-12.
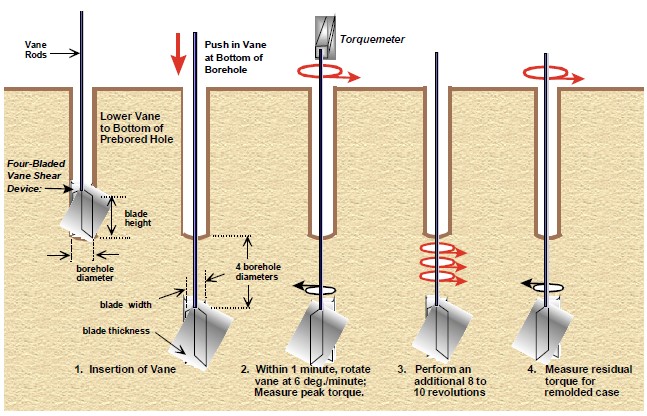
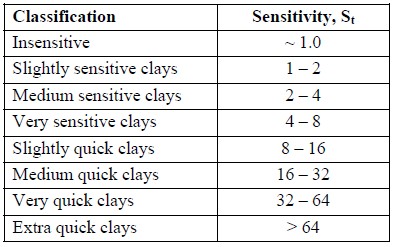
1.13 Groundwater Measurements
Observations of the groundwater level and pore water pressure are an important part of all geotechnical explorations. The identification of groundwater conditions should receive the same level of care given to soil descriptions and samples. Measurements of water entry during drilling and measurements of the groundwater level at least once following drilling should be considered a minimum effort to obtain water level data, unless alternate methods, such as installation of observation wells, are defined by the geotechnical specialist. Detailed information regarding groundwater observations can be obtained from ASTM D 4750 and ASTM D 5092.
1.13.1 Information on Existing Wells
Many states require the drillers of water wells to file logs of the wells they have drilled. These are good sources of information of the materials encountered and water levels recorded during well installation. The well owners, both public and private, may have records of the water levels after installation, which may provide extensive information on fluctuations of the water level. This information may be available at state agencies regulating the drilling and installation of water wells, such as the Department of Transportation, the Department of Natural Resources, State Geologist, Hydrology Department, Department of Environmental Quality, and Division of Water Resources.
1.13.2 Open Borings
The water level in open borings should be measured after any prolonged interruption in drilling, at the completion of each boring, and at least 12 hours (preferably 24 hours) after completion of drilling. Additional water level measurements should be made at the completion of the field exploration and at other times designated by the engineer. The date and time of each observation should be recorded.
If the borehole has caved, the depth to the collapsed region should be recorded on the boring record as the collapse may have been caused by groundwater conditions. The elevations of the caved depths of certain borings may be consistent with groundwater table elevations at the site. This consistency may become apparent once the subsurface profile is constructed.
Drilling mud obscures observations of the groundwater level owing to filter cake action and the greater specific gravity of the drilling mud compared to that of the water. If drilling fluids are used to advance borings, the drill crew should be instructed to bail the hole prior to making groundwater observations.
1.13.3 Observation Wells
The observation well, also referred to as a piezometer, is the fundamental means for measuring water head in an aquifer and for evaluating the performance of dewatering systems. In theory, a “piezometer” measures the water pressure in a confined aquifer or at a specific horizon of the geologic profile, while an “observation well” measures the level of a water table in an aquifer (Powers, 1992). In practice, however, the two terms are often used interchangeably to describe any device for determining static water head.
The term “observation well” is applied to any well or drilled hole used for the purpose of long-term studies of groundwater levels and pressures. Existing wells and bore holes in which casing is left in place are often used to observe groundwater levels. These, however, are not considered to be as satisfactory as wells constructed specifically for the purpose of measuring groundwater conditions. The latter may consist of a standpipe installed in a previously drilled exploratory hole or a hole drilled solely for use as an observation well.
Details of typical observation well installations are shown in Figure 1-35. The simplest type of observation well is formed by a small-diameter polyvinyl chloride (PVC) pipe set in an open hole. The bottom of the pipe is slotted and capped, and the annular space around the slotted pipe is backfilled with clean sand. The area above the sand is sealed with bentonite, and the remaining annulus is filled with grout, concrete, or soil cuttings. A surface seal, which is sloped away from the pipe, is commonly formed with concrete in order to prevent the entrance of surface water. The top of the pipe should also be capped to prevent the entrance of foreign material; there should be a small vent hole in the top of the removable cap. In some localities, regulatory agencies may stipulate the manner for installation and closure of observation wells.
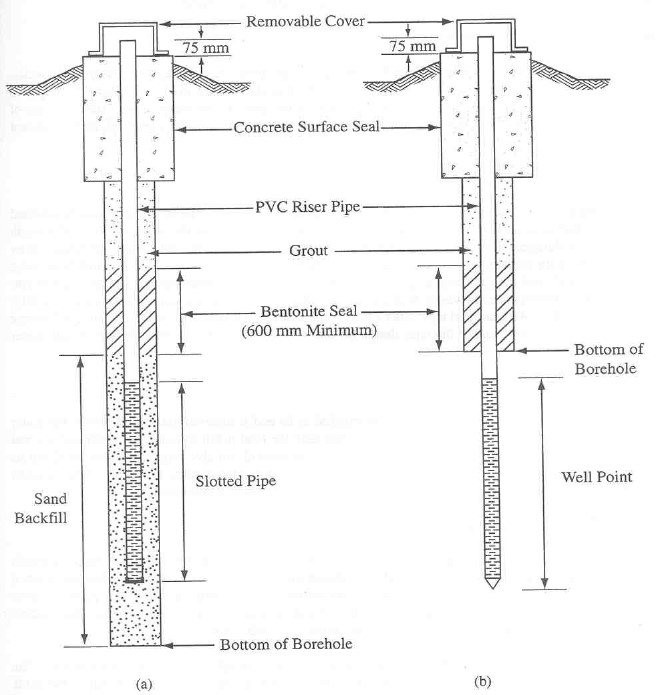
Driven or pushed-in well points are another common type of observation well for use in granular soil formations and very soft clay (Figure 1-35b). The well is formed by a stainless steel or brass well point threaded to a galvanized steel pipe. In granular soils, an open boring or rotary wash boring is advanced to a point several inches above the measurement depth and the well point is driven to the desired depth. A seal is commonly required in the boring above the well point with a surface seal at the ground surface. Note that observation wells may require development (see ASTM D 5092) to minimize the effects of installation, drilling fluids, etc. Minimum pipe diameters should allow introduction of a bailer or other pumping apparatus to remove fine-grained materials in the well to improve the response time.
Local jurisdictions may impose specific requirements on “permanent” observation wells, including closure and reporting of the location and construction that must be considered in the planning and installation. Licensed drillers and special fees may be required.
Piezometers are available in a number of designs. Commonly used piezometers are of the pneumatic and the vibrating wire type. Interested readers are directed to Dunnicliff (1988) and FHWA (1997) for a detailed discussion of the various types of piezometers.
1.13.4 Water Level Measurements
A number of devices have been developed for sensing or measuring the water level in observation wells. Following is a brief presentation of three methods that are commonly used to measure the depth to groundwater. In general, common practice is to measure the depth to the water surface by using the top of the casing as a reference, with the reference point at a common orientation (often north) marked or notched on the well casing.
1.13.4.1 Chalked Tape
In this method a short section at the lower end of a metal tape is chalked. The tape with a weight attached to its end is then lowered until the chalked section has passed slightly below the water surface. The depth to the water is determined by subtracting the depth of penetration of the line into water, as measured by the water line in the chalked section, from the total depth from the top of casing. This is probably the most accurate method, and the accuracy is useful in pump tests where very small drawdowns are significant. The method is cumbersome, however, when a series of rapid readings is taken since the tape must be fully removed each time. An enameled tape is not suitable unless it is roughened with sandpaper so it will accept chalk. The weight on the end of the tape should be small in volume so it does not displace enough water to create an error in the water level.
1.13.4.2 Tape with a Float
In this method, a tape with a flat-bottomed float attached to its end is lowered until the float hits the water surface and the tape goes slack. The tape is then lifted until the float is felt to touch the water surface and the tape is just taut; the depth to the water surface is then measured. With practice this method can give rough measurements, but its accuracy is poor. A refinement is to mount a heavy whistle, open at the bottom, on a tape. When it sinks in the water, the whistle will give an audible beep as the air within it is displaced.
1.13.4.3 Electric Water-Level Indicator
This battery operated indicator consists of a weighted electric probe attached to the lower end of a length of electrical cable that is marked at intervals to indicate the depth. When the probe reaches the water a circuit is completed. This condition is registered by a meter mounted on the cable reel. Various manufacturers produce the instrument, utilizing a neon lamp, a horn, or an ammeter as the signaling device. The electric indicator has the advantage that it may be used in extremely small holes.
The instrument should be ruggedly built, since some degree of rough handling can be expected. The distance markings must be securely fastened to the cable. Some models are available in which the cable itself is manufactured as a measuring tape. The sensing probe should be shielded to prevent shorting out against metal risers. When the water is highly conductive, erratic readings can develop in the moist air above the actual water level. Sometimes careful attention to the intensity of the neon lamp or the pitch of the horn will enable the reader to distinguish the true level. A sensitivity adjustment on the instrument can be useful. If oil or iron sludge has accumulated in the observation well, the electric probe will give unreliable readings.
1.13.4.4 Data Loggers
When timed and frequent water level measurements are required, as for a pump test or slug test, data loggers are useful. Data loggers are in the form of an electric transducer near the bottom of the well that senses changes in water level as changes in pressure. A data acquisition system is used to acquire and store the readings. A data logger can eliminate the need for onsite technicians on night shifts during extended field permeability testing. A further significant saving is in the technician’s time back in the office. The preferred models of the data logger not only record the water level readings but permit the data to be downloaded into a personal computer and, with appropriate software, to be quickly reduced and plotted. These devices are also extremely useful for cases where measurement of artesian pressures is required or where data for tidal corrections during field permeability tests are necessary.
1.14 Guidelines for Minimum Subsurface Exploration
In regard to the scope of the subsurface exploration program for a structure or a geotechnical feature, one must consider the small cost of the borings in relation to the foundation costs. The knowledge gained from a thorough subsurface exploration program will allow the geotechnical specialist to evaluate various candidate foundation schemes and provide recommendations for those that can be built most efficiently and economically on the project site. Without an adequate subsurface exploration program, the result is generally an extremely conservative foundation recommendation.
Planning a subsurface exploration program should include determining the location and depth of borings, test pits, or other procedures to be used and establishing the methods of soil sampling and testing to be employed. Usually, the extent of the work is estimated based on available geological studies, earlier explorations, or records of existing structures. The number of borings and their locations in a site area will depend on the proposed structure, design parameters, access issues, geologic constraints, and expected stratigraphy.
Although no rigid rules apply universally to geotechnical explorations, certain general principles are usually followed in practice. Recommended guidelines for the minimum number of exploration points and their spacing are provided in Table 1-13. This table was developed based on a number of FHWA documents. This table should be used only as a first step in estimating the minimum number of borings for a particular design, as actual boring spacings will be dependent upon the project type and geologic environment. In all cases, it is recommended that the depth of the exploration should be such that the depth of significant influence (DOSI) is explored. For a given configuration of loading, the DOSI may exceed the minimum guidelines in Table 1-13 in which case the depth of exploration should be increased accordingly. Some other general guidance in addition to that in Table 1-13 is as follows:
In areas underlain by heterogeneous soil deposits and/or rock formations, it will probably be necessary to exceed the minimum guidelines presented in Table 1-13 to capture variations in soil and/or rock type and to assess consistency across the site.

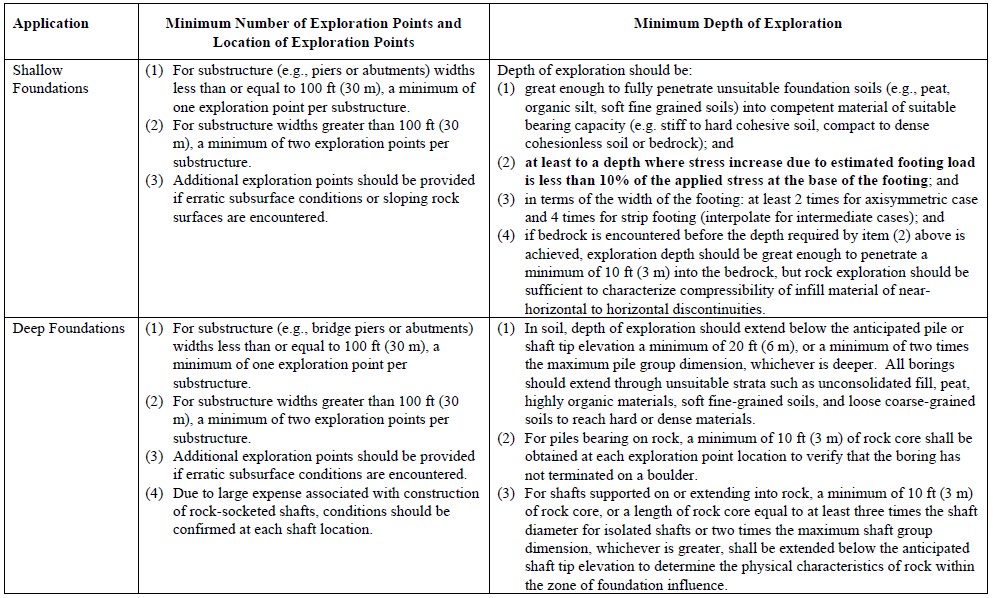
- In the case of embankments, the guidance provided in Table 1-13 for the depth of exploration is the minimum recommended for any transportation facility, i.e., 2 times the height of the embankment. The minimum guidance may not be the same as the DOSI, which is a function of the geometry (crest width, height, configuration of side slopes, and the base width) of the embankment. For the same height of embankment, the DOSI increases as the base width of an embankment increases, and may vary from 4 to 6 times the height of the embankment. This may be particularly critical in cases where there are soft soils in the subsurface. Thus, for such situations, the geotechnical specialist should use tools such as the FoSSA program or published elastic solutions (Poulos and Davis, 1974) to determine the depth of exploration.
- For situations where large-diameter rock-socketed shafts will be used or where drilled shafts are being installed in karstic formations, it may be necessary to advance a boring at the location of each shaft.
- In a laterally homogeneous area, drilling or advancing a large number of borings may be redundant, since each sample tested would exhibit similar strength and compressibility properties.
- In all cases, it is necessary to understand how the design and construction of the geotechnical feature will affect the soil and/or rock mass in order to optimize the exploration.
During exploration, each exploration point (e.g., drill hole or CPT sounding) should be designated by a unique identification number to prevent duplication during subsequent explorations. For example, it is not unusual to find projects where borehole numbering was done by only single numbers so that the same designations were used during one or more subsequent explorations. A suggested method to avoid duplication is to designate that all bridge holes begin with the letter “B,” followed by the initials of the highway or river being crossed and finally a sequential number. For example, the first boring for a structure on Apple Freeway would be designated DH-BAF-1, where the DH means a “drill hole” where SPTs were performed as opposed to CPT-BAF-1, where the CPT refers to the first CPT sounding performed for a bridge structure on Apple Freeway.
The geotechnical specialist should plot the proposed boring locations on a site topographic map prior to initiation of drilling. Notes taken during the site visit should be reviewed before boring locations are selected so that site access restrictions can be considered. Boring locations should never be selected arbitrarily or randomly. Alternate boring locations should be considered and a contingency plan should be developed in case a boring needs to be relocated due to access restrictions or unexpected geologic conditions (e.g., locate a replacement boring within a maximum of 15 ft (4.5 m) from the location of a boring that could not be drilled at a particular location). Field personnel unfamiliar with the objectives and rationale behind the planning of the site exploration should maintain contact with the person in responsible charge of the field exploration during field activities and discuss issues such as the relocation of a boring with that person. Arbitrary or random boring selection will increase the chances of boring relocation, confusion, and wasted time in the field. Final boring locations should be surveyed and recorded as part of the permanent project record. Elevations and northing and easting should be provided for each boring.
1.14.1 Recommendations for Sampling
Depth Intervals in Soils It is difficult to establish a prescriptive drilling, sampling, and testing protocol that is applicable to all sites. To be most effective the geotechnical specialist should:
(1) apply conventional guidelines with project-specific requirements and constraints;
(2) recognize the advantages and limitations of the available sampling devices and in-situ testing methods.
Some general recommendations for minimum sampling depth intervals are as follows:
- For preliminary screening, disturbed samples might be taken continuously in the upper 10 ft (3 m), at 5 ft (1.5 m) intervals up to 100 ft (30 m), and possibly every10 ft (3 m) at depths greater than 100 ft (30 m).
- Disturbed samples should be taken at every abrupt change in stratum as indicated by a noticeable change in the drilling pressure.
- Where footings are to be placed on natural soil, continuous spoon samples are recommended for a depth equal to 15 ft (4.5 m) or 1.5 times the width of the footing, whichever is greater, as measured below the anticipated footing base elevation.
- For characterization and assessment of design properties in fine-grained soils, a minimum of one undisturbed sample should be taken in each stratum, with additional samples taken at 10- to 20-ft (3 to 6 m) intervals with depth.
- Undisturbed Shelby tube samples should be obtained at 5 ft (1.5 m) intervals in at least one boring in cohesive soils. For cohesive deposits greater than 30 ft (9 m) in depth, the tube sample interval can be increased to 10 ft (3 m). Undisturbed samples may not need to be taken in each boring if the deposit is relatively homogeneous within closely spaced borings.
These minimum guidelines and intervals may need to be increased depending upon the project requirements and site geologic conditions. The sampling interval may need to be increased when soil/rock conditions change frequently with depth; however, these changes need to be considered in the context of the design. Therefore, ongoing communication between field personnel and the office/design engineer is absolutely essential. Once the site stratigraphy has been established, it may not be necessary to sample every time there is a change in stratigraphy if the changes have no impact on design. For example, it may not be necessary to sample alternating layers of coarse-grained deposits where settlement is of concern, and for designs concerned with bearing capacity. Similarly, although samples below the anticipated extent of the area influenced by the load may be reduced, samples should be obtained in case the type of foundation changes between preliminary and final design.
The sampling interval will vary between individual projects and regional geologies. If soils are anticipated to be difficult to sample or trim in the laboratory due to defects (e.g., bent tubes, improper handling, etc.), the frequency of sample collection should be greater than average to offset the number of samples that may be unusable in the laboratory for performance property evaluation (e.g., shear strength). When borings are widely spaced, it may be appropriate to retrieve undisturbed samples in each boring. For closely spaced borings or in deposits of lateral uniformity, undisturbed samples may be needed only in select borings. If a thin clay seam is encountered during drilling and not sampled, the boring may need to be offset and re-drilled to obtain a sample.
It is often quite helpful to combine in-situ soundings with conventional disturbed/undisturbed sampling. For example, by performing CPT or CPTu soundings prior to conventional drilling and sampling, it may be possible to target representative and/or critical areas where samples can be obtained later. This concept was illustrated previously by the discussion in Section 1.9.7 and Figure 1-30. The use of precursor soundings may reduce some of the potential drilling redundancy in heterogeneous environments. Geophysical methods can also
be used to provide useful information on conditions between and even beyond boring locations.
1.14.2 Recommendations for Sampling Depth Intervals in Rocks
For explorations for slopes and foundations within rock, it is important to consider structural geology in addition to the information obtained as part of a rock-coring program. For example, the orientation and characteristics of a clay-filled discontinuity are critical since they can be used to judge whether a rock slope will be stable or unstable or whether a structural foundation will undergo minor or significant settlement. A detailed structural geologic assessment may provide enough information to limit the scope of a rock-coring program significantly or even preclude such a program. For example, drilling and coring may not be required where applied loads are significantly less than the bearing capacity of the rock, where there is no possibility of sliding instability in a rock slope, or where there are extensive rock outcrops from which information can be obtained to establish the subsurface conditions confidently for design and constructability assessments (Wyllie, 1999).
1.14.3 Recommendations for Water Level Monitoring in Borings
The water level in each boring should be observed and the depth below the top of hole recorded on the drill log with the date and time of the reading for each of the following situations:
a)Water seepage or artesian pressure encountered during drilling. Artesian pressure may be measured by extending drill casing above the ground until flow stops. Report the pressure as the number of ft (m) of head above ground.
b)Water level at the end of each day and at completion of boring.
c)Water level 24 hours (minimum) after hole completion. Long term readings may require installation of a perforated plastic tube before abandoning the hole.
A false indication of water level may be obtained when water is used in drilling and adequate time is not permitted after the boring is completed for the water level to stabilize. In low permeability soils, such as clays, more than one week may be required to obtain accurate readings. Proper safety precautions should be taken if a hole is allowed to remain open for such an extended period of time.
1.15 Geophysical Tests
As indicated in Section 1.3, geophysical testing can be used as part of the initial site exploration to provide supplementary information to data collected by other means (i.e., borings, test pits, geologic surveys, etc.). Geophysical testing can be used for establishing stratification of subsurface materials, the profile of the top of bedrock, the depth to groundwater, the boundaries of various types of soil deposits, the rippability of hard soil and rock, and the presence and depth of voids, buried pipes, and existing foundations. Data from geophysical testing should always be correlated with information from the direct methods of exploration discussed previously.
1.15.1 Types of Geophysical Tests
There are a number of different types of geophysical in-situ tests that can be used to obtain stratigraphic information from which engineering properties can be estimated. Table 1-14 provides a summary of the various geophysical methods that are currently available in U.S. practice. Further information on the procedures used for these methods is provided in FHWA (2003). Additional general discussion regarding the major test methods listed in Table 1-14 is presented below, with particular emphasis on potential applications to highway engineering.
- Seismic Methods: These methods are becoming increasingly popular for geotechnical engineering practice because they have the potential to provide data regarding the compression and shear wave velocities of the subsurface materials. The shear wave velocity is directly related to small-strain material stiffness, which, in turn, is often correlated to compressive strength and soil/rock type. These techniques are often used for assessing the vertical stiffness profile in a soil deposit and for assessing the location at depth of the interface between soil and rock. Seismic refraction method involves measurement of time of arrival of the initial ground motion generated by the energy source while the seismic reflection method involves measurement of the energy arrival after the initial ground motion.
- Electrical Methods: These methods are usually used to locate voids or locally distinct materials. With regards to highway applications, these procedures may be used to assess the potential for karst activity along a planned transportation corridor, or for locating large underground voids and/or specific underground anomalies such as storage drums and/or tanks. Electrical methods provide qualitative information only and are usually part of a two- or three-phased exploration program.
- Gravity and Magnetic Methods: These methods are similar to electrical methods, except that they rely on correlations between the potential gravitational and/or magnetic influence of voids and subsurface anomalies and measured differences in the earth’s micro-gravitational and/or magnetic fields, rather than on changes in electrical fields. These methods provide measurements at specific points unlike seismic and electrical methods that provide measurements over large areas.
- Near-surface nuclear methods: These methods have been used for several years for compaction control of fills in the field. Through careful calibration, it is possible to assess the moisture content and density of compacted soils reliably. These methods have been widely adopted as reliable quantitative methods.
- Borehole Methods: Downhole geophysical methods provide reliable indications of a wide range of soil properties. For example, downhole/crosshole methods provide reliable measures of shear wave velocity. As indicated previously, shear wave velocity is directly related to small-strain stiffness and is correlated to strength and soil/rock type. Although downhole logging methods have seen little use in highway construction, they have been the mainstay for deep geologic characterization in oil exploration. The principal advantage of downhole logging is the ability to obtain several different geophysical tests/indicators by “stringing” these tools together in a deep borehole.


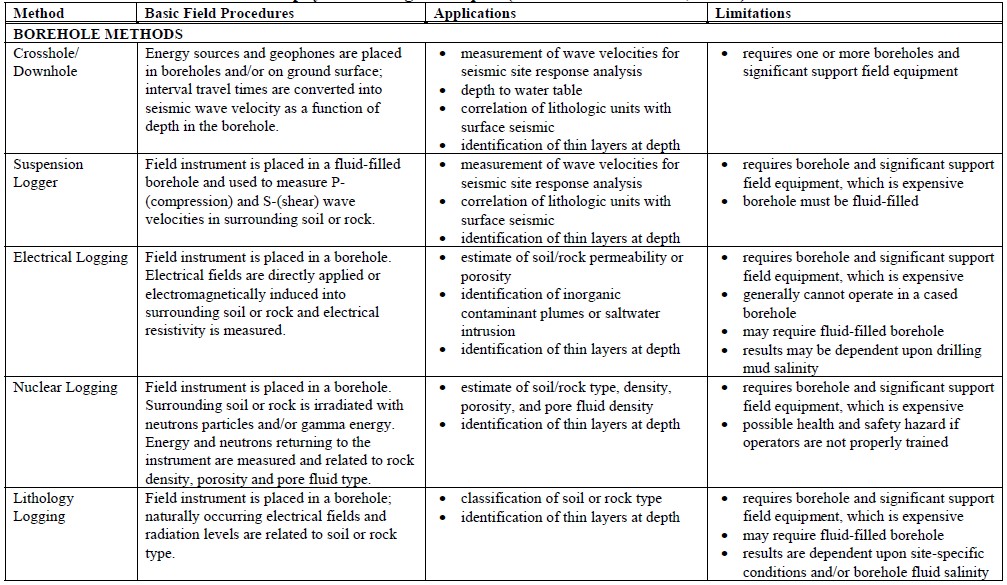
1.15.2 Advantages and Disadvantages of Geophysical Tests
As with the other methods of exploration, geophysical testing offers some advantages and some disadvantages that should be considered before these techniques are recommended for a specific application. These are summarized as follows:
1.15.2.1 Advantages of Geophysical Tests
- Many geophysical tests are non-invasive. Therefore such tests offer significant benefits in cases where conventional drilling, testing, and sampling are difficult (e.g., deposits of gravel, talus deposits, etc.) or where potentially contaminated soils may occur in the subsurface.
- In general, geophysical testing can cover a relatively large geographical area there by providing the opportunity to characterize large areas with relatively few tests. Geophysical testing is particularly well-suited to projects that have large longitudinal extent such as new highway construction.
- Geophysical measurements are used to assess the properties of soil and rock at very small strains, typically on the order of 0.001 percent, thereby providing information on truly elastic properties.
- For the purpose of obtaining information on the subsurface, geophysical methods are relatively inexpensive considering the large area over which they provide information.
1.15.2.2 Disadvantages of Geophysical Tests
- Most methods work best for situations in which there is a large difference in the property being measured between adjacent subsurface units. In seismic methods, it is difficult to develop good stratigraphic profiling if the general stratigraphy consists of hard material overlying soft material.
- Each geophysical method has limitations that may be associated with equipment, signal noise, unfavorable site and subsurface conditions, and processing constraints.
- Results can be non-unique and are generally interpreted qualitatively. Therefore useful results can be obtained only through analyses performed by a geotechnical specialist experienced with the particular testing method.
- Specialized and more electronically sophisticated equipment is required as compared to the more conventional subsurface exploration tools.
1.15.3 Examples of Uses of Geophysical Tests
The following are a few examples where geophysical testing could be used on highway projects to compliment conventional exploration.
- Highly Variable Subsurface Conditions: In several geologic settings, the subsurface conditions along a transportation corridor may be expected to be variable. This variability could be from underlying karst development above limestone; alluvial deposits, including buried terrace gravels, across a wide floodplain; buried boulders in a talus slope, etc. For these cases, conventional exploration techniques may be very difficult and if “refusal” is encountered at one depth, there is a strong likelihood that different materials could underlie the region. Development of a preliminary subsurface characterization profile by using geophysical testing could prove advantageous in designing future focused explorations.
- Regional Studies: Along a transportation corridor it may be necessary to assess the depth to (and through) rippable rock or highly cemented caliche. Alternative alignments may or may not be possible, but the cost implications may be significant. Therefore, it is important to obtain a profile related to rock/soil stiffness. Geophysical testing is a logical consideration for this application as a precursor to invasive explorations.
- Settlement Sensitive Structures: The prior two examples related to cases where the geophysical testing served as the front-end of a multi-phase project. In the case where a settlement-sensitive structure is to be founded on deposits of sands, knowledge of the in-situ modulus of the sand deposit is critical. After the characteristics of the site are assessed, it may be helpful to quantify the deformation modulus by the use of geophysical testing at the specific foundation site.
These examples demonstrate that geophysical testing can play a potentially important role in the subsurface characterization of soils and rocks. As with the other investigative “tools” described in this document, the particular selection of the appropriate technology is very much a function of the site conditions and the goals of the characterization program.