Chapter 1: Bonding, Lattice Types, Grain Structure and Boundary
Atomic Bonding
Matter, as we know it, exists in three common states. These three states are solid, liquid, and gas. The atomic or molecular interactions that occur within a substance determine its state. In this chapter, we will deal primarily with solids because solids are of the most concern in engineering applications of materials. Liquids and gases will be mentioned for comparative purposes only.
Solid matter is held together by forces originating between neighboring atoms or molecules. These forces arise because of differences in the electron clouds of atoms. In other words, the valence electrons, or those in the outer shell, of atoms determine their attraction for their neighbors. When physical attraction between molecules or atoms of a material is great, the material is held tightly together. Molecules in solids are bound tightly together. When the attractions are weaker, the substance may be in a liquid form and free to flow. Gases exhibit virtually no attractive forces between atoms or molecules, and their particles are free to move independently of each other.
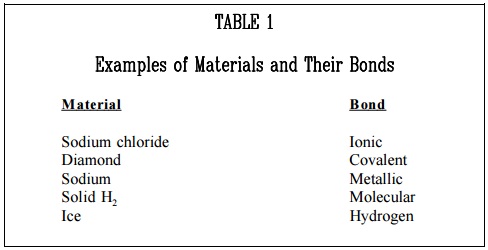
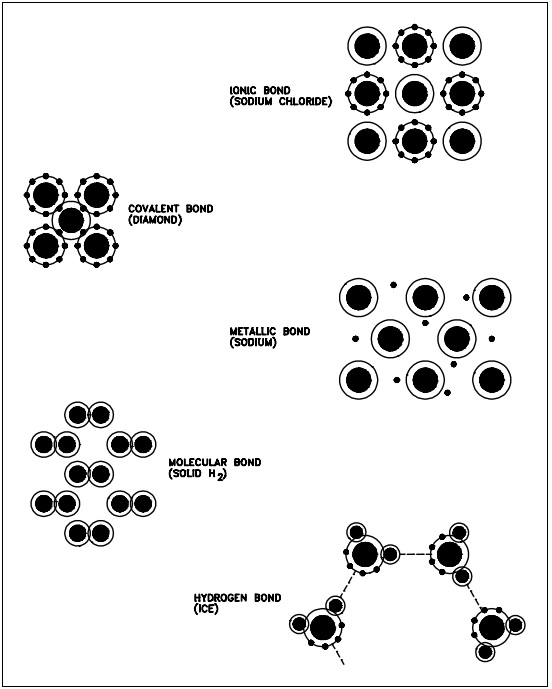
The types of bonds in a material are determined by the manner in which forces hold matter together. Figure 1 illustrates several types of bonds and their characteristics are listed below
a. Ionic bond – In this type of bond, one or more electrons are wholly transferred from an atom of one element to the atom of the other, and the elements are held together by the force of attraction due to the opposite polarity of the charge.
b. Covalent bond – A bond formed by shared electrons. Electrons are shared when an atom needs electrons to complete its outer shell and can share those electrons with its neighbor. The electrons are then part of both atoms and both shells are filled.
c. Metallic bond – In this type of bond, the atoms do not share or exchange electrons to bond together. Instead, many electrons (roughly one for each atom) are more or less free to move throughout the metal, so that each electron can interact with many of the fixed atoms.
d. Molecular bond – When the electrons of neutral atoms spend more time in one region of their orbit, a temporary weak charge will exist. The molecule will weakly attract other molecules. This is sometimes called the van der Waals or molecular bonds.
e. Hydrogen bond – This bond is similar to the molecular bond and occurs due to the ease with which hydrogen atoms are willing to give up an electron to atoms of oxygen, fluorine, or nitrogen.
The type of bond not only determines how well a material is held together, but also determines what microscopic properties the material possesses. Properties such as the ability to conduct heat or electrical current are determined by the freedom of movement of electrons. This is dependent on the type of bonding present. Knowledge of the microscopic structure of a material allows us to predict how that material will behave under certain conditions. Conversely, a material may be synthetically fabricated with a given microscopic structure to yield properties desirable for certain engineering applications.
Order in Microstructures
Solids have greater interatomic attractions than liquids and gases. However, there are wide variations in the properties of solid materials used for engineering purposes. The properties of materials depend on their interatomic bonds. These same bonds also dictate the space between the configuration of atoms in solids. All solids may be classified as either amorphous or crystalline.
Amorphous
Amorphous materials have no regular arrangement of their molecules. Materials like glass and paraffin are considered amorphous. Amorphous materials have the properties of solids. They have definite shape and volume and diffuse slowly. These materials also lack sharply defined melting points. In many respects, they resemble liquids that flow very slowly at room temperature.
Crystalline
In a crystalline structure, the atoms are arranged in a three-dimensional array called a lattice. The lattice has a regular repeating configuration in all directions. A group of particles from one part of a crystal has exactly the same geometric relationship as a group from any other part of the same crystal.
Lattice Types
Common Crystal Structures
In metals, and in many other solids, the atoms are arranged in regular arrays called crystals. A crystal structure consists of atoms arranged in a pattern that repeats periodically in a three-dimensional geometric lattice. The forces of chemical bonding causes this repetition. It is this repeated pattern which control properties like strength, ductility, density (described in later chapters), conductivity (property of conducting or transmitting heat, electricity, etc.), and shape.
In general, the three most common basic crystal patterns associated with metals are: (a) the body-centered cubic, (b) the face-centered cubic, and (c) the hexagonal close-packed. Figure 2 shows these three patterns.
Body-centered Cubic
In a body-centered cubic (BCC) arrangement of atoms, the unit cell consists of eight atoms at the corners of a cube and one atom at the body center of the cube.
Face-centered Cubic
In a face-centered cubic (FCC) arrangement of atoms, the unit cell consists of eight atoms at the corners of a cube and one atom at the center of each of the faces of the cube.
Hexagonal Close-packed
In a hexagonal close-packed (HCP) arrangement of atoms, the unit cell consists of three layers of atoms. The top and bottom layers contain six atoms at the corners of a hexagon and one atom at the center of each hexagon. The middle layer contains three atoms nestled between the atoms of the top and bottom layers, hence, the name close-packed.
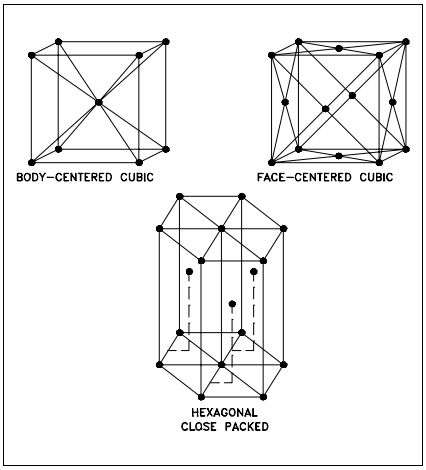
Most diagrams of the structural cells for the BCC and FCC forms of iron are drawn as though they are of the same size, as shown in Figure 2, but they are not. In the BCC arrangement, the structural cell, which uses only nine atoms, is much smaller.
Metals such as α-iron (Fe) (ferrite), chromium (Cr), vanadium (V), molybdenum (Mo), and tungsten (W) possess BCC structures. These BCC metals have two properties in common, high strength and low ductility (which permits permanent deformation). FCC metals such as γ-iron (Fe) (austenite), aluminum (Al), copper (Cu), lead (Pb), silver (Ag), gold (Au), nickel (Ni), platinum (Pt), and thorium (Th) are, in general, of lower strength and higher ductility than BCC metals. HCP structures are found in beryllium (Be), magnesium (Mg), zinc (Zn), cadmium (Cd), cobalt (Co), thallium (Tl), and zirconium (Zr).
Grain Structure and Boundary
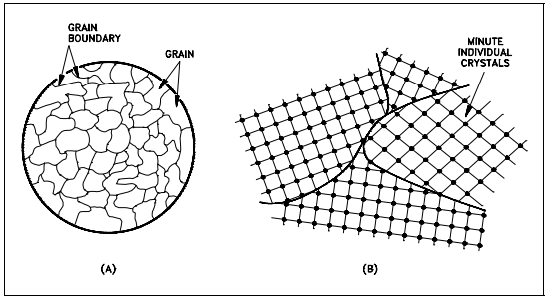
If you were to take a small section of a common metal and examine it under a microscope, you would see a structure similar to that shown in Figure 3(a). Each of the light areas is called a grain, or crystal, which is the region of space occupied by a continuous crystal lattice. The dark lines surrounding the grains are grain boundaries. The grain structure refers to the arrangement of the grains in a metal, with a grain having a particular crystal structure. The grain boundary refers to the outside area of a grain that separates it from the other grains.
The grain boundary is a region of misfit between the grains and is usually one to three atom diameters wide. The grain boundaries separate variously-oriented crystal regions (polycrystalline) in which the crystal structures are identical. Figure 3(b) represents four grains of different orientation and the grain boundaries that arise at the interfaces between the grains.
A very important feature of a metal is the average size of the grain. The size of the grain determines the properties of the metal. For example, smaller grain size increases tensile strength and tends to increase ductility. A larger grain size is preferred for improved high-temperature creep properties. Creep is the permanent deformation that increases with time under constant load or stress. Creep becomes progressively easier with increasing temperature.
Another important property of the grains is their orientation. Figure 4(a) represents a random arrangement of the grains such that no one direction within the grains is aligned with the external boundaries of the metal sample. This random orientation can be obtained by cross rolling the material. If such a sample were rolled sufficiently in one direction, it might develop a grain-oriented structure in the rolling direction as shown in Figure 4(b). This is called preferred orientation. In many cases, preferred orientation is very desirable, but in other instances, it can be most harmful. For example, preferred orientation in uranium fuel elements can result in catastrophic changes in dimensions during use in a nuclear reactor.
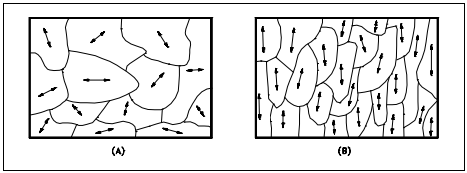
(a) Random (b) Preferred
Chapter 2: Polymorphism, Alloys, and Imperfections in Metals
Polymorphism
Polymorphism is the property or ability of a metal to exist in two or more crystalline forms depending upon temperature and composition. Most metals and metal alloys exhibit this property. Uranium is a good example of a metal that exhibits polymorphism. Uranium metal can exist in three different crystalline structures. Each structure exists at a specific phase, as illustrated in Figure 5.

1. The alpha phase, from room temperature to 663°C
2. The beta phase, from 663°C to 764°C
3. The gamma phase, from 764°C to its melting point of 1133°C
Alpha Phase
The alpha (α) phase is stable at room temperature and has a crystal system characterized by three unequal axes at right angles.
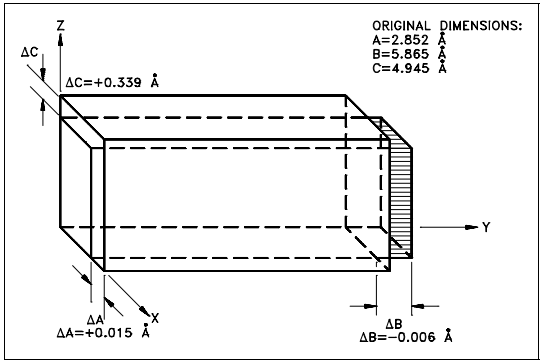
In the alpha phase, the properties of the lattice are different in the X, Y, and Z axes. This is because of the regular recurring state of the atoms is different. Because of this condition, when heated the phase expands in the X and Z directions and shrinks in the Y direction. Figure 6 shows what happens to the dimensions (Å = angstrom, one hundred-millionth of a centimeter) of a unit cell of alpha uranium upon being heated.
As shown, heating and cooling of alpha phase uranium can lead to drastic dimensional changes and gross distortions of the metal. Thus, pure uranium is not used as a fuel, but only in alloys or compounds.
Beta Phase
The beta (β) phase of uranium occurs at elevated temperatures. This phase has a tetragonal (having four angles and four sides) lattice structure and is quite complex.
Gamma Phase
The gamma (γ) phase of uranium is formed at temperatures above those required for beta phase stability. In the gamma phase, the lattice structure is BCC and expands equally in all directions when heated.
Additional Examples
Alloys
An alloy is a mixture of two or more materials, at least one of which is a metal. Alloys can have a microstructure consisting of solid solutions, where secondary atoms are introduced as substitutionals or interstitials in a crystal lattice. An alloy might also be a crystal with a metallic compound at each lattice point. In addition, alloys may be composed of secondary crystals imbedded in a primary polycrystalline matrix. This type of alloy is called a composite (although the term “composite” does not necessarily imply that the component materials are metals).
Common Characteristics of Alloys
Alloys are usually stronger than pure metals, although they generally offer reduced electrical and thermal conductivity. Strength is the most important criterion by which many structural materials are judged. Therefore, alloys are used for engineering construction. Steel, probably the most common structural metal, is a good example of an alloy. It is an alloy of iron and carbon, with other elements to give it certain desirable properties.
As mentioned in the previous chapter, it is sometimes possible for a material to be composed of several solid phases. The strengths of these materials are enhanced by allowing a solid structure to become a form composed of two interspersed phases. When the material in question is an alloy, it is possible to quench the metal from a molten state to form the interspersed phases. The type and rate of quenching determines the final solid structure and, therefore, its properties.
Type 304 Stainless Steel
Type 304 stainless steel (containing 18%-20% chromium and 8%-10.5% nickel) is used in the tritium production reactor tanks, process water piping, and original process heat exchangers. This alloy resists most types of corrosion.
Composition of Common Engineering Materials
The wide variety of structures, systems, and components found in general industry are made from many different types of materials. Many of the materials are alloys with a base metal of iron, nickel, or zirconium. The selection of a material for a specific application is based on many factors including the temperature and pressure that the material will be exposed to, the materials resistance to specific types of corrosion, the materials toughness and hardness, and other material properties.
One material that has wide application in the multiple systems is stainless steel. There are nearly 40 standard types of stainless steel and many other specialized types under various trade names. Through the modification of the kinds and quantities of alloying elements, the steel can be adapted to specific applications. Stainless steels are classified as austenitic or ferritic based on their lattice structure. Austenitic stainless steels, including 304 and 316, have a facecentered cubic structure of iron atoms with the carbon in interstitial solid solution. Ferritic stainless steels, including type 405, have a body-centered cubic iron lattice and contain no nickel. Ferritic steels are easier to weld and fabricate and are less susceptible to stress corrosion cracking than austenitic stainless steels. They have only moderate resistance to other types of chemical attack.
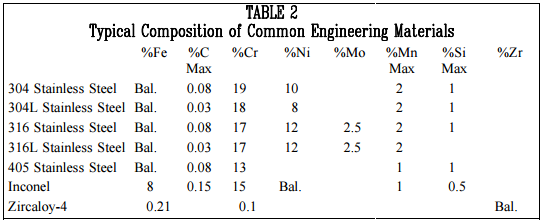
Other metals that have specific applications in some critical applications are inconel and zircaloy. The composition of these metals and various types of stainless steel are listed in Table 2 below.
Imperfections in Metals
[HR] Microscopic Imperfections
Microscopic imperfections are generally classified as either point, line, or interfacial imperfections.
1. Point imperfections have atomic dimensions.
2. Line imperfections or dislocations are generally many atoms in length.
3. Interfacial imperfections are larger than line defects and occur over a twodimensional area.
Point Imperfections
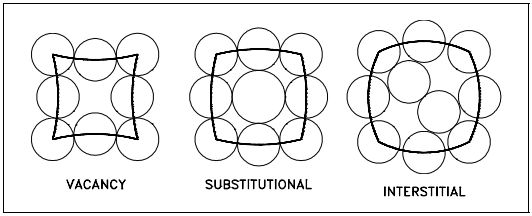
Point imperfections in crystals can be divided into three main defect categories. They are illustrated in Figure 7.
1. Vacancy defects result from a missing atom in a lattice position. The vacancy type of defect can result from imperfect packing during the crystallization process, or it may be due to increased thermal vibrations of the atoms brought about by elevated temperature.
2. Substitutional defects result from an impurity present at a lattice position.
3. Interstitial defects result from an impurity located at an interstitial site or one of the lattice atoms being in an interstitial position instead of being at its lattice position. Interstitial refers to locations between atoms in a lattice structure.
Interstitial impurities called network modifiers act as point defects in amorphous solids. The presence of point defects can enhance or lessen the value of a material for engineering construction depending upon the intended use.
Line Imperfections
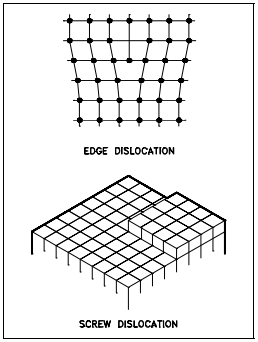
Line imperfections are called dislocations and occur in crystalline materials only. Dislocations can be an edge type, screw type, or mixed type, depending on how they distort the lattice, as shown in Figure 8. It is important to note that dislocations cannot end inside a crystal. They must end at a crystal edge or other dislocation, or they must close back on themselves.
Edge dislocations consist of an extra row or plane of atoms in the crystal structure. The imperfection may extend in a straight line all the way through the crystal or it may follow an irregular path. It may also be short, extending only a small distance into the crystal causing a slip of one atomic distance along the glide plane (direction the edge imperfection is moving).
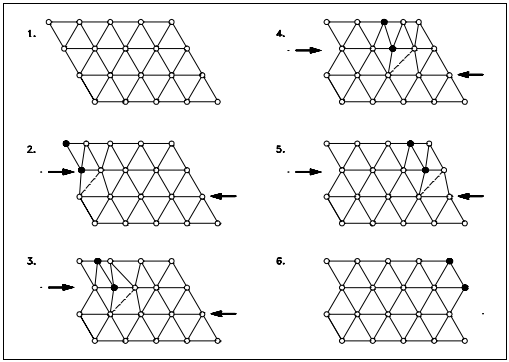
The slip occurs when the crystal is subjected to a stress, and the dislocation moves through the crystal until it reaches the edge or is arrested by another dislocation, as shown in Figure 9. Position 1 shows a normal crystal structure. Position 2 shows a force applied from the left side and a counterforce applied from the right side. Positions 3 to 5 show how the structure is slipping. Position 6 shows the final deformed crystal structure. The slip of one active plane is ordinarily on the order of 1000 atomic distances and, to produce yielding, slip on many planes is required.
Screw dislocations can be produced by a tearing of the crystal parallel to the slip direction. If a screw dislocation is followed all the way around a complete circuit, it would show a slip pattern similar to that of a screw thread. The pattern may be either left or right handed. This requires that some of the atomic bonds are re-formed continuously so that the crystal has almost the same form after yielding that it had before.
The orientation of dislocations may vary from pure edge to pure screw. At some intermediate point, they may possess both edge and screw characteristics. The importance of dislocations is based on the ease at which they can move through crystals.
Interface Imperfections
Interfacial imperfections exist at an angle between any two faces of a crystal or crystal form. These imperfections are found at free surfaces, domain boundaries, grain boundaries, or interphase boundaries. Free surfaces are interfaces between gases and solids. Domain boundaries refer to interfaces where electronic structures are different on either side causing each side to act differently although the same atomic arrangement exists on both sides. Grain boundaries exist between crystals of similar lattice structure that possess different spacial orientations. Polycrystalline materials are made up of many grains which are separated by distances typically of several atomic diameters. Finally, interphase boundaries exist between the regions where materials exist in different phases (i.e., BCC next to FCC structures).
Macroscopic Defects
Three-dimensional macroscopic defects are called bulk defects. They generally occur on a much larger scale than the microscopic defects. These macroscopic defects generally are introduced into a material during refinement from its raw state or during fabrication processes.
The most common bulk defect arises from foreign particles being included in the prime material. These second-phase particles, called inclusions, are seldom wanted because they significantly alter the structural properties. An example of an inclusion may be oxide particles in a pure metal or a bit of clay in a glass structure.
Other bulk defects include gas pockets or shrinking cavities found generally in castings. These spaces weaken the material and are therefore guarded against during fabrication. The working and forging of metals can cause cracks that act as stress concentrators and weaken the material. Any welding or joining defects may also be classified as bulk defects.
Chapter 3: Stress and Strain
Definition of Stress
When a metal is subjected to a load (force), it is distorted or deformed, no matter how strong the metal or light the load. If the load is small, the distortion will probably disappear when the
load is removed. The intensity, or degree, of distortion is known as strain. If the distortion disappears and the metal returns to its original dimensions upon removal of the load, the strain
is called elastic strain. If the distortion disappears and the metal remains distorted, the strain type is called plastic strain. Strain will be discussed in more detail in the next chapter.
When a load is applied to metal, the atomic structure itself is strained, being compressed, warped or extended in the process. The atoms comprising a metal are arranged in a certain
geometric pattern, specific for that particular metal or alloy, and are maintained in that pattern by interatomic forces. When so arranged, the atoms are in their state of minimum energy and
tend to remain in that arrangement. Work must be done on the metal (that is, energy must be added) to distort the atomic pattern. (Work is equal to force times the distance the force
moves.)
Stress is the internal resistance, or counterfource, of a material to the distorting effects of an external force or load. These counterforces tend to return the atoms to their normal positions.
The total resistance developed is equal to the external load. This resistance is known as stress.
Although it is impossible to measure the intensity of this stress, the external load and the area
to which it is applied can be measured. Stress (s) can be equated to the load per unit area or the force (F) applied per cross-sectional area (A) perpendicular to the force as shown in
Equation (2-1).
Stress = σ = F / A (2-1)
where:
s = stress (psi or lbs of force per in.2)
F = applied force (lbs of force per in.2)
A = cross-sectional area (in.2)
Types of Stress
Stresses occur in any material that is subject to a load or any applied force. There are many types of stresses, but they can all be generally classified in one of six categories: residual
stresses, structural stresses, pressure stresses, flow stresses, thermal stresses, and fatigue stresses.
Residual Stress
Residual stresses are due to the manufacturing processes that leave stresses in a material. Welding leaves residual stresses in the metals welded. Stresses associated with welding are further discussed later in this module.
Structural Stress
Structural stresses are stresses produced in structural members because of the weights they support. The weights provide the loadings. These stresses are found in building foundations and frameworks, as well as in machinery parts.
Pressure stresses
Pressure stresses are stresses induced in vessels containing pressurized materials. The loading is provided by the same force producing the pressure.
Flow stresses
Flow stresses occur when a mass of flowing fluid induces a dynamic pressure on a conduit wall. The force of the fluid striking the wall acts as the load. This type of stress may be applied in an unsteady fashion when flow rates fluctuate. Water hammer is an example of a transient flow stress.
Thermal stresses
Thermal stresses exist whenever temperature gradients are present in a material. Different temperatures produce different expansions and subject materials to internal stress. This type of stress is particularly noticeable in mechanisms operating at high temperatures that are cooled by a cold fluid.
Fatigue stresses
Fatigue stresses are due to cyclic application of a stress. The stresses could be due to vibration or thermal cycling.
The importance of all stresses is increased when the materials supporting them are flawed. Flaws tend to add additional stress to a material. Also, when loadings are cyclic or unsteady, stresses can effect a material more severely. The additional stresses associated with flaws and cyclic loading may exceed the stress necessary for a material to fail.Types of Applied Stress
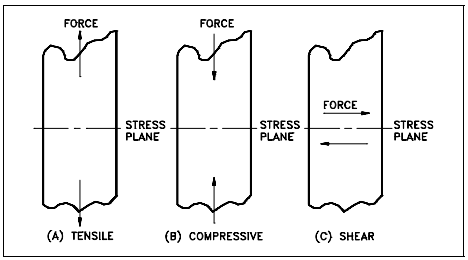
Stress intensity within the body of a component is expressed as one of three basic types of internal load. They are known as tensile, compressive, and shear. Figure 1 illustrates the different types of stress. Mathematically, there are only two types of internal load because tensile and compressive stress may be regarded as the positive and negative versions of the same type of normal loading.
However, in mechanical design, the response of components to the two conditions can be so different that it is better, and safer, to regard them as separate types.
As illustrated in Figure 1, the plane of a tensile or compressive stress lies perpendicular to the axis of operation of the force from which it originates. The plane of a shear stress lies in the plane of the force system from which it riginates. It is essential to keep these differences
quite clear both in mind and mode of expression.
Tensile stress
Tensile stress is that type of stress in which the two sections of material on either side of a stress plane tend to pull apart or elongate as illustrated in Figure 1(a).
Compressive stress
Compressive stress is the reverse of tensile stress. Adjacent parts of the material tend to press against each other through a typical stress plane as illustrated in Figure 1(b).
Shear stress
Shear stress exists when two parts of a material tend to slide across each other in any typical plane of shear upon application of force parallel to that plane as illustrated in Figure 1(c).
Assessment of mechanical properties is made by addressing the three basic stress types. Because tensile and compressive loads produce stresses that act across a plane, in a direction perpendicular (normal) to the plane, tensile and compressive stresses are called normal stresses. The shorthand designations are as follows.For tensile stresses: “+SN” (or “SN“) or “σ” (sigma)
For compressive stresses: “-SN” or “-σ” (minus sigma)
The ability of a material to react to compressive stress or pressure is called compressibility. For example, metals and liquids are incompressible, but gases and vapors are compressible. The shear stress is equal to the force divided by the area of the face parallel to the direction in which the force acts, as shown in Figure 1(c).
Two types of stress can be present simultaneously in one plane, provided that one of the stresses is shear stress. Under certain conditions, different basic stress type combinations may be simultaneously present in the material. An example would be a reactor vessel during operation. The wall has tensile stress at various locations due to the temperature and pressure of the fluid acting on the wall. Compressive stress is applied from the outside at other locations on the wall due to outside pressure, temperature, and constriction of the supports associated with the vessel. In this situation, the tensile and compressive stresses are considered principal stresses. If present, shear stress will act at a 90° angle to the principal stress.
Strain
Definition of Strain
In the use of metal for mechanical engineering purposes, a given state of stress usually exists in a considerable volume of the material. Reaction of the atomic structure will manifest itself on a macroscopic scale. Therefore, whenever a stress (no matter how small) is applied to a metal, a proportional dimensional change or distortion must take place.
Such a proportional dimensional change (intensity or degree of the distortion) is called strain and is measured as the total elongation per unit length of material due to some applied stress. Equation 2-2 illustrates this proportion or distortion.
Strain = ε = δ/L (2-2)
where:
ε = strain (in./in.)
δ = total elongation (in.)
L = original length (in.)
Types of Strain
Strain may take two forms; elastic strain and plastic deformation.
Elastic Strain
Elastic strain is a transitory dimensional change that exists only while the initiating stress is applied and disappears immediately upon removal of the stress. Elastic strain is also called elastic deformation. The applied stresses cause the atoms in a crystal to move from their equilibrium position. All the atoms are displaced the same amount and still maintain their relative geometry. When the stresses are removed, all the atoms return to their original positions and no permanent deformation occurs.
Plastic Deformation
Plastic deformation (or plastic strain) is a dimensional change that does not disappear when the initiating stress is removed. It is usually accompanied by some elastic strain.
The phenomenon of elastic strain and plastic deformation in a material are called elasticity and plasticity, respectively.At room temperature, most metals have some elasticity, which manifests itself as soon as the slightest stress is applied. Usually, they also possess some plasticity, but this may not become apparent until the stress has been raised appreciably. The magnitude of plastic strain, when it does appear, is likely to be much greater than that of the elastic strain for a given stress increment. Metals are likely to exhibit less elasticity and more plasticity at elevated temperatures. A few pure unalloyed metals (notably aluminum, copper and gold) show little, if any, elasticity when stressed in the annealed (heated and then cooled slowly to prevent brittleness) condition at room temperature, but do exhibit marked plasticity. Some unalloyed metals and many alloys have marked elasticity at room temperature, but no plasticity.
The state of stress just before plastic strain begins to appear is known as the proportional limit, or elastic limit, and is defined by the stress level and the corresponding value of elastic strain. The proportional limit is expressed in pounds per square inch. For load intensities beyond the proportional limit, the deformation consists of both elastic and plastic strains.
As mentioned previously in this chapter, strain measures the proportional dimensional change with no load applied. Such values of strain are easily determined and only cease to be sufficiently accurate when plastic strain becomes dominant.
When metal experiences strain, its volume remains constant. Therefore, if volume remains constant as the dimension changes on one axis, then the dimensions of at least one other axis must change also. If one dimension increases, another must decrease. There are a few exceptions. For example, strain hardening involves the absorption of strain energy in the material structure, which results in an increase in one dimension without an offsetting decrease in other dimensions. This causes the density of the material to decrease and the volume to increase.
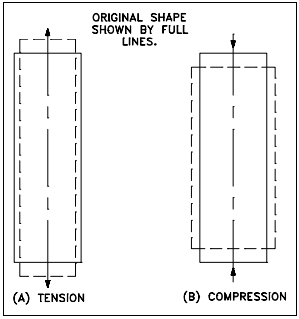
If a tensile load is applied to a material, the material will elongate on the axis of the load (perpendicular to the tensile stress plane), as illustrated in Figure 2(a). Conversely, if the load is compressive, the axial dimension will decrease, as illustrated in Figure 2(b). If volume is constant, a corresponding lateral contraction or expansion must occur. This lateral change will bear a fixed relationship to the axial strain. The relationship, or ratio, of lateral to axial strain is called Poisson’s ratio after the name of its discoverer. It is usually symbolized by ν.
Deformation of Cubic Structures
Whether or not a material can deform plastically at low applied stresses depends on its lattice structure. It is easier for planes of atoms to slide by each other if those planes are closely packed. Therefore lattice structures with closely packed planes allow more plastic deformation than those that are not closely packed. Also, cubic lattice structures allow slippage to occur more easily than non-cubic lattices. This is because of their symmetry which provides closely packed planes in several directions. Most metals are made of the body-centered cubic (BCC), face-centered cubic (FCC), or hexagonal close-packed (HCP) crystals, discussed in more detail in the Module 1, Structure of Metals. A face-centered cubic crystal structure will deform more readily under load before breaking than a body-centered cubic structure.
The BCC lattice, although cubic, is not closely packed and forms strong metals. α-iron and tungsten have the BCC form. The FCC lattice is both cubic and closely packed and forms more ductile materials. γ-iron, silver, gold, and lead are FCC structured. Finally, HCP lattices are closely packed, but not cubic. HCP metals like cobalt and zinc are not as ductile as the FCC metals.
Chapter 4: Young’s Modulus and Stress-Strain Relationship
Hook’s Law
If a metal is lightly stressed, a temporary deformation, presumably permitted by an elastic displacement of the atoms in the space lattice, takes place. Removal of the stress results in a gradual return of the metal to its original shape and dimensions. In 1678 an English scientist named Robert Hooke ran experiments that provided data that showed that in the elastic range of a material, strain is proportional to stress. The elongation of the bar is directly proportional to the tensile force and the length of the bar and inversely proportional to the cross-sectional area and the modulus of elasticity.
Hooke’s experimental law may be given by Equation (2-3).
δ = P l /A E (2-3)
This simple linear relationship between the force (stress) and the elongation (strain) was formulated using the following notation.
P = force producing extension of bar (lbf)
l = length of bar (in.)
A = cross-sectional area of bar (in.2 )
δ = total elongation of bar (in.)
E = elastic constant of the material, called the Modulus of Elasticity, or Young’s Modulus (lbf/in.2 )
The quantity E, the ratio of the unit stress to the unit strain, is the modulus of elasticity of the material in tension or compression and is often called Young’s Modulus.
Previously, we learned that tensile stress, or simply stress, was equated to the load per unit area or force applied per cross-sectional area perpendicular to the force measured in pounds force per square inch.
σ = P / A (2-4)
We also learned that tensile strain, or the elongation of a bar per unit length, is determined by:
ε = δ/l (2-5)
Thus, the conditions of the experiment described above are adequately expressed by Hooke’s Law for elastic materials. For materials under tension, strain (ε) is proportional to applied stress σ.
ε = σ/E (2-6)
where
E = Young’s Modulus (lbf/in.2)
σ = stress (psi)
ε = strain (in./in.)
Young’s Modulus (Elastic Modulus)
Young’s Modulus (sometimes referred to as Modulus of Elasticity, meaning “measure” of elasticity) is an extremely important characteristic of a material. It is the numerical evaluation of Hooke’s Law, namely the ratio of stress to strain (the measure of resistance to elastic deformation). To calculate Young’s Modulus, stress (at any point) below the proportional limit is divided by corresponding strain. It can also be calculated as the slope of the straight-line portion of the stress-strain curve. (The positioning on a stress-strain curve will be discussed later.)
E = Elastic Modulus = stress/strain = psi / in. in. = psi
or
E = σ / ε (2-7)
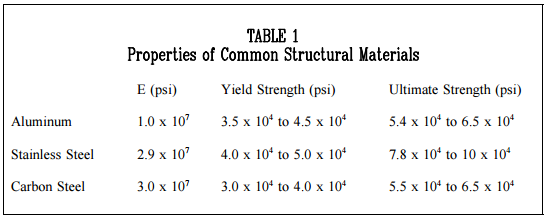
We can now see that Young’s Modulus may be easily calculated, provided that the stress and corresponding unit elongation or strain have been determined by a tensile test as described previously. Strain (ε) is a number representing a ratio of two lengths; therefore, we can conclude that the Young’s Modulus is measured in the same units as stress (σ), that is, in pounds per square inch. Table 1 gives average values of the Modulus E for several metals used in industry. Yield strength and ultimate strength will be discussed in more detail in next section below.
Stress-Strain Relationship
Elastic Moduli
The elastic moduli relevant to polycrystalline material are Young’s Modulus of Elasticity, the Shear Modulus of Elasticity, and the Bulk Modulus of Elasticity.
Young’s Modulus
Young’s Modulus of Elasticity is the elastic modulus for tensile and compressive stress and is usually assessed by tensile tests. Young’s Modulus of Elasticity is discussed in detail above.
Shear Modulus
The Shear Modulus of Elasticity is derived from the torsion of a cylindrical test piece. Its symbol is G.
Bulk Modulus
The Bulk Modulus of Elasticity is the elastic response to hydrostatic pressure and equilateral tension or the volumetric response to hydrostatic pressure and equilateral tension. It is also the property of a material that determines the elastic response to the application of stress.
Tensile (Load) Tests and Stress-Strain Curves
To determine the load-carrying ability and the amount of deformation before fracture, a sample of material is commonly tested by a Tensile Test. This test consists of applying a gradually increasing force of tension at one end of a sample length of the material. The other end is anchored in a rigid support so that the sample is slowly pulled apart. The testing machine is equipped with a device to indicate, and possibly record, the magnitude of the force throughout the test. Simultaneous measurements are made of the increasing length of a selected portion at the middle of the specimen, called the gage length. The measurements of both load and elongation are ordinarily discontinued shortly after plastic deformation begins; however, the maximum load reached is always recorded. Fracture point is the point where the material fractures due to plastic deformation. After the specimen has been pulled apart and removed from the machine, the fractured ends are fitted together and measurements are made of the now extended gage length and of the average diameter of the minimum cross section. The average diameter of the minimum cross section is measured only if the specimen used is cylindrical.
The tabulated results at the end of the test consist of the following.
a. designation of the material under test
b. original cross section dimensions of the specimen within the gage length
c. original gage length
d. a series of frequent readings identifying the load and the corresponding gage length dimension
e. final average diameter of the minimum cross section
f. final gage length
g. description of the appearance of the fracture surfaces (for example, cup-cone, wolf’s ear, diagonal, start)
A graph of the results is made from the tabulated data. Some testing machines are equipped with an autographic attachment that draws the graph during the test. (The operator need not record any load or elongation readings except the maximum for each.) The coordinate axes of the graph are strain for the x-axis or scale of abscissae, and stress for the y-axis or scale of ordinates. The ordinate for each point plotted on the graph is found by dividing each of the tabulated loads by the original cross-sectional area of the sample; the corresponding abscissa of each point is found by dividing the increase in gage length by the original gage length. These two calculations are made as follows.
Stress = load/area of original cross section = P/Ao = psi or lbm/in2 (2-9)
Strain = (instantaneous gage length – original) /original gage length = elongation/original gage length (2-10)
= (L – Lo) / Lo = inches per inch x 100 = percent elongation (2-11)
Stress and strain, as computed here, are sometimes called “engineering stress and strain.” They are not true stress and strain, which can be computed on the basis of the area and the gage length that
exist for each increment of load and deformation. For example, true strain is the natural log of the elongation (ln (L/Lo)), and true stress is P/A, where A is area. The latter values are usually used for scientific investigations, but the engineering values are useful for determining the loadcarrying values of a material. Below the elastic limit, engineering stress and true stress are almost identical.
The graphic results, or stress-strain diagram, of a typical tension test for structural steel is shown in Figure 3. The ratio of stress to strain, or the gradient of the stress-strain graph, is called the Modulus of Elasticity or Elastic Modulus. The slope of the portion of the curve where stress is proportional to strain (between Points 1 and 2) is referred to as Young’s Modulus and Hooke’s Law applies.
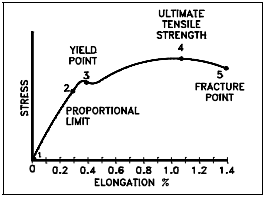
Hooke’s Law applies between Points 1 and 2.
Hooke’s Law becomes questionable between Points 2 and 3 and strain increases more rapidly.
The area between Points 1 and 2 is called the elastic region. If stress is removed, the material will return to its original length.
Point 2 is the proportional limit (PL) or elastic limit, and Point 3 is the yield strength (YS) or yield point.
The area between Points 2 and 5 is known as the plastic region because the material will not return to its original length.
Point 4 is the point of ultimate strength and Point 5 is the fracture point at which failure of the material occurs.
Figure 3 is a stress-strain curve typical of a ductile material where the strength is small, and the plastic region is great. The material will bear more strain (deformation) before fracture.
Figure 4 is a stress-strain curve typical of a brittle material where the plastic region is small and the strength of the material is high.
The tensile test supplies three descriptive facts about a material. These are the stress at which observable plastic deformation or “yielding” begins; the ultimate tensile strength or maximum intensity of load that can be carried in tension; and the percent elongation or strain (the amount the material will stretch) and the accompanying percent reduction of the cross-sectional area caused by stretching. The rupture or fracture point can also be determined.
Chapter 5: Physical Properties
Strength
Strength is the ability of a material to resist deformation. The strength of a component is usually considered based on the maximum load that can be borne before failure is apparent. If under simple tension the permanent deformation (plastic strain) that takes place in a component before failure, the load-carrying capacity, at the instant of final rupture, will probably be less than the maximum load supported at a lower strain because the load is being applied over a significantly smaller cross-sectional area. Under simple compression, the load at fracture will be the maximum applicable over a significantly enlarged area compared with the cross-sectional area under no load.
This obscurity can be overcome by utilizing a nominal stress figure for tension and shear. This is found by dividing the relevant maximum load by the original area of cross section of the component. Thus, the strength of a material is the maximum nominal stress it can sustain. The nominal stress is referred to in quoting the “strength” of a material and is always qualified by the type of stress, such as tensile strength, compressive strength, or shear strength.
For most structural materials, the difficulty in finding compressive strength can be overcome by substituting the tensile strength value for compressive strength. This substitution is a safe assumption since the nominal compression strength is always greater than the nominal tensile strength because the effective cross section increases in compression and decreases in tension.
When a force is applied to a metal, layers of atoms within the crystal structure move in relation to adjacent layers of atoms. This process is referred to as slip. Grain boundaries tend to prevent slip. The smaller the grain size, the larger the grain boundary area. Decreasing the grain size through cold or hot working of the metal tends to retard slip and thus increases the strength of the metal. Cold and hot working are discussed in the next chapter.
Ultimate Tensile Strength
The ultimate tensile strength (UTS) is the maximum resistance to fracture. It is equivalent to the maximum load that can be carried by one square inch of cross-sectional area when the load is applied as simple tension. It is expressed in pounds per square inch.
UTS = maximum load/area of original cross section = Pmax / Ao = psi
If the complete engineering stress-strain curve is available, as shown in Figure 3, the ultimate tensile strength appears as the stress coordinate value of the highest point on the curve. Materials that elongate greatly before breaking undergo such a large reduction of cross-sectional area that the material will carry less load in the final stages of the test (this was noted in Figure 3 and Figure 4 by the decrease in stress just prior to rupture). A marked decrease in cross-section is called “necking.” Ultimate tensile strength is often shortened to “tensile strength” or even to “the ultimate.” “Ultimate strength” is sometimes used but can be misleading and, therefore, is not used in some disciplines.
Yield Strength
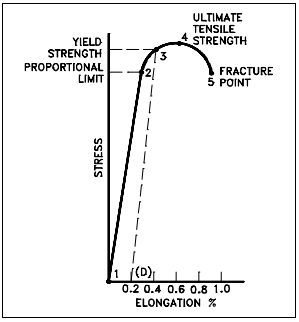
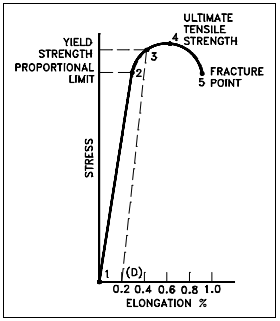
A number of terms have been defined for the purpose of identifying the stress at which plastic deformation begins. The value most commonly used for this purpose is the yield strength. The yield strength is defined as the stress at which a predetermined amount of permanent deformation occurs. The graphical portion of the early stages of a tension test is used to evaluate yield strength. To find yield strength, the predetermined amount of permanent strain is set along the strain axis of the graph, to the right of the origin (zero). It is indicated in Figure 5 as Point (D). Rev. 0
A straight line is drawn through Point (D) Figure 5 Typical Brittle Material Stress-Strain Curve at the same slope as the initial portion of the stress-strain curve. The point of intersection of the new line and the stressstrain curve is projected to the stress axis. The stress value, in pounds per square inch, is the yield strength. It is indicated in Figure 5 as Point 3. This method of plotting is done for the purpose of subtracting the elastic strain from the total strain, leaving the predetermined “permanent offset” as a remainder. When yield strength is reported, the amount of offset used in the determination should be stated. For example, “Yield Strength (at 0.2% offset) = 51,200 psi.”
Examples of Yield Strength
Some examples of yield strength for metals are as follows.
Aluminum 3.5 x 10⁴ to 4.5 x 10⁴ psi
Stainless steel 4.0 x 10⁴ to 5.0 x 10⁴ psi
Carbon steel 3.0 x 10⁴ to 4.0 x 10⁴ psi
Alternate values
Alternate values are sometimes used instead of yield strength. Several of these are briefly described below.
• The yield point, determined by the divider method, involves an observer with a pair of dividers watching for visible elongation between two gage marks on the specimen. When visible stretch occurs, the load at that instant is recorded, and the stress corresponding to that load is calculated.
• Soft steel, when tested in tension, frequently displays a peculiar characteristic, known as a yield point. If the stress-strain curve is plotted, a drop in the load (or sometimes a constant load) is observed although the strain continues to increase. Eventually, the metal is strengthened by the deformation, and the load increases with further straining. The high point on the S-shaped portion of the curve, where yielding began, is known as the upper yield point, and the minimum point is the lower yield point. This phenomenon is very troublesome in certain deep drawing operations of sheet steel. The steel continues to elongate and to become thinner at local areas where the plastic strain initiates, leaving unsightly depressions called stretcher strains or “worms.”
• The proportional limit is defined as the stress at which the stress-strain curve first deviates from a straight line. Below this limiting value of stress, the ratio of stress to strain is constant, and the material is said to obey Hooke’s Law (stress is proportional to strain). The proportional limit usually is not used in specifications because the deviation begins so gradually that controversies are sure to arise as to the exact stress at which the line begins to curve.
• The elastic limit has previously been defined as the stress at which plastic deformation begins. This limit cannot be determined from the stress-strain curve. The method of determining the limit would have to include a succession of slightly increasing loads with intervening complete unloading for the detection of the first plastic deformation or “permanent set.” Like the proportional limit, its determination would result in controversy. Elastic limit is used, however, as a descriptive, qualitative term.
In many situations, the yield strength is used to identify the allowable stress to which a material can be subjected. For components that have to withstand high pressures, such as those used in pressurized water reactors (PWRs), this criterion is not adequate. To cover these situations, the maximum shear stress theory of failure has been incorporated into the ASME (The American Society of Mechanical Engineers) Boiler and Pressure Vessel Code, Section III, Rules for Construction of Nuclear Pressure Vessels.
Ductility
The percent elongation reported in a tensile test is defined as the maximum elongation of the gage length divided by the original gage length. The measurement is determined as shown in Figure 6.
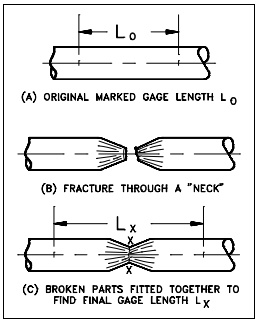
Percent elongation = final gage length – initial gage length/ initial gage length (2-13)
= (Lx – Lo / Lo) = inches per inch x 100 (2-14)
Reduction of area is the proportional reduction of the cross-sectional area of a tensile test piece at the plane of fracture measured after fracture.
Percent reduction of area (RA) =
area of original cross section – minimum final area / area of original cross section (2-15)
= (A0 – Amin) / Ao = decrease in area / original area = sq. in. / sq. in. x 100 (2-16)
The reduction of area is reported as additional information (to the percent elongation) on the deformational characteristics of the material. The two are used as indicators of ductility, the ability of a material to be elongated in tension. Because the elongation is not uniform over the entire gage length and is greatest at the center of the neck, the percent elongation is not an absolute measure of ductility. (Because of this, the gage length must always be stated when the percent elongation is reported.) The reduction of area, being measured at the minimum diameter of the neck, is a better indicator of ductility.Ductility is more commonly defined as the ability of a material to deform easily upon the application of a tensile force, or as the ability of a material to withstand plastic deformation without rupture. Ductility may also be thought of in terms of bendability and crushability. Ductile materials show large deformation before fracture. The lack of ductility is often termed brittleness. Usually, if two materials have the same strength and hardness, the one that has the higher ductility is more desirable. The ductility of many metals can change if conditions are altered. An increase in temperature will increase ductility. A decrease in temperature will cause a decrease in ductility and a change from ductile to brittle behavior. Irradiation will also decrease ductility.
Cold-working also tends to make metals less ductile. Cold-working is performed in a temperature region and over a time interval to obtain plastic deformation, but not relieving the strain hardening. Minor additions of impurities to metals, either deliberate or unintentional, can have a marked effect on the change from ductile to brittle behavior. The heating of a cold-worked metal to or above the temperature at which metal atoms return to their equilibrium positions will increase the ductility of that metal. This process is called annealing.
Ductility is desirable in the high temperature and high pressure applications in reactor plants because of the added stresses on the metals. High ductility in these applications helps prevent brittle fracture.
Malleability
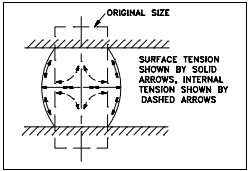
Where ductility is the ability of a material to deform easily upon the application of a tensile force, malleability is the ability of a metal to exhibit large deformation or plastic response when being subjected to compressive force. Uniform compressive force causes deformation in the manner shown in Figure 7. The material contracts axially with the force and expands laterally. Restraint due to friction at the contact faces induces axial tension on the outside. Tensile forces operate around the circumference with the lateral expansion or increasing girth. Plastic flow at the center of the material also induces tension.
Therefore, the criterion of fracture (that is, the limit of plastic deformation) for a plastic material is likely to depend on tensile rather than compressive stress. Temperature change may modify both the plastic flow mode and the fracture mode.
Toughness
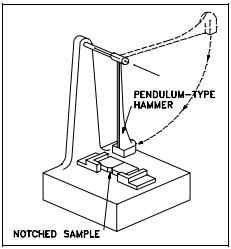
The quality known as toughness describes the way a material reacts under sudden impacts. It is defined as the work required to deform one cubic inch of metal until it fractures. Toughness is measured by the Charpy test or the Izod test.
Both of these tests use a notched sample. The location and shape of the notch are standard. The points of support of the sample, as well as the impact of the hammer, must bear a constant relationship to the location of the notch.
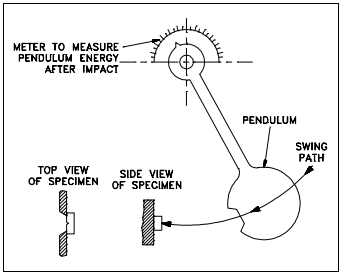
The tests are conducted by mounting the samples as shown in Figure 8 and allowing a pendulum of a known weight to fall from a set height. The maximum energy developed by the hammer is 120 ft-lb in the Izod test and 240 ft-lb in the Charpy test. By properly calibrating the machine, the energy absorbed by the specimen may be measured from the upward swing of the pendulum after it has fractured the material specimen as shown in Figure 9. The greater the amount of energy absorbed by the specimen, the smaller the upward swing of the pendulum will be and the tougher the material is.
Indication of toughness is relative and applicable only to cases involving exactly this type of sample and method of loading. A sample of a different shape will yield an entirely different result. Notches confine the deformation to a small volume of metal that reduces toughness. In effect, it is the shape of the metal in addition to the material composition that determines the toughness of the material.
Hardness
Hardness is the property of a material that enables it to resist plastic deformation, penetration, indentation, and scratching. Therefore, hardness is important from an engineering standpoint because resistance to wear by either friction or erosion by steam, oil, and water generally increases with hardness.
Hardness tests serve an important need in industry even though they do not measure a unique quality that can be termed hardness. The tests are empirical, based on experiments and observation, rather than fundamental theory. Its chief value is as an inspection device, able to detect certain differences in material when they arise even though these differences may be undefinable. For example, two lots of material that have the same hardness may or may not be alike, but if their hardness is different, the materials certainly are not alike.
Several methods have been developed for hardness testing. Those most often used are Brinell, Rockwell, Vickers, Tukon, Sclerscope, and the files test. The first four are based on indentation tests and the fifth on the rebound height of a diamond-tipped metallic hammer. The file test establishes the characteristics of how well a file takes a bite on the material.
As a result of many tests, comparisons have been prepared using formulas, tables, and graphs that show the relationships between the results of various hardness tests of specific alloys. There is, however, no exact mathematical relation between any two of the methods. For this reason, the result of one type of hardness test converted to readings of another type should carry the notation ” converted from ” (for example “352 Brinell converted from Rockwell C-38”).
Another convenient conversion is that of Brinell hardness to ultimate tensile strength. For quenched and tempered steel, the tensile strength (psi) is about 500 times the Brinell hardness number (provided the strength is not over 200,000 psi).
How Alloys Affect Physical Properties
Nickel is an important alloying element. In concentrations of less than 5%, nickel will raise the toughness and ductility of steel without raising the hardness. It will not raise the hardness when added in these small quantities because it does not form carbides, solid compounds with carbon.
Chromium in steel forms a carbide that hardens the metal. The chromium atoms may also occupy locations in the crystal lattice, which will have the effect of increasing hardness without affecting ductility. The addition of nickel intensifies the effects of chromium, producing a steel with increased hardness and ductility.
Copper is quite similar to nickel in its effects on steel. Copper does not form a carbide, but increases hardness by retarding dislocation movement.
Molybdenum forms a complex carbide when added to steel. Because of the structure of the carbide, it hardens steel substantially, but also minimizes grain enlargement. Molybdenum tends to augment the desirable properties of both nickel and chromium.
Stainless steels are alloy steels containing at least 12% chromium. An important characteristic of these steels is their resistance to many corrosive conditions.
Chapter 6: Working of Metals and Corrosion
Heat Treatment
Heat treatment of large carbon steel components is done to take advantage of crystalline defects and their effects and thus obtain certain desirable properties or conditions.
During manufacture, by varying the rate of cooling (quenching) of the metal, grain size and grain patterns are controlled. Grain characteristics are controlled to produce different levels of hardness and tensile strength. Generally, the faster a metal is cooled, the smaller the grain sizes will be. This will make the metal harder. As hardness and tensile strength increase in heat-treated steel, toughness and ductility decrease.
The cooling rate used in quenching depends on the method of cooling and the size of the metal. Uniform cooling is important to prevent distortion. Typically, steel components are quenched in oil or water.
Because of the crystal pattern of type 304 stainless steel in the reactor tank (tritium production facility), heat treatment is unsuitable for increasing the hardness and strength.
Welding can induce internal stresses that will remain in the material after the welding is completed. In stainless steels, such as type 304, the crystal lattice is face-centered cubic (austenite). During high temperature welding, some surrounding metal may be elevated to between 500°F and 1000°F. In this temperature region, the austenite is transformed into a bodycentered cubic lattice structure (bainite). When the metal has cooled, regions surrounding the weld contain some original austenite and some newly formed bainite. A problem arises because the “packing factor” (PF = volume of atoms/volume of unit cell) is not the same for FCC crystals as for BCC crystals.The bainite that has been formed occupies more space than the original austenite lattice. This elongation of the material causes residual compressive and tensile stresses in the material. Welding stresses can be minimized by using heat sink welding, which results in lower metal temperatures, and by annealing.
Annealing is another common heat treating process for carbon steel components. During annealing, the component is heated slowly to an elevated temperature and held there for a long period of time, then cooled. The annealing process is done to obtain the following effects.a. to soften the steel and improve ductility
b. to relieve internal stresses caused by previous processes such as heat treatment, welding, or machining
c. to refine the grain structure
Cold and Hot Working
Plastic deformation which is carried out in a temperature region and over a time interval such that the strain hardening is not relieved is called cold work. Considerable knowledge on the structure of the cold-worked state has been obtained. In the early stages of plastic deformation, slip is essentially on primary glide planes and the dislocations form coplanar arrays. As deformation proceeds, cross slip takes place. The cold-worked structure forms high dislocation density regions that soon develop into networks. The grain size decreases with strain at low deformation but soon reaches a fixed size. Cold working will decrease ductility.
Hot working refers to the process where metals are deformed above their recrystallization temperature and strain hardening does not occur. Hot working is usually performed at elevated temperatures. Lead, however, is hot-worked at room temperature because of its low melting temperature. At the other extreme, molybdenum is cold-worked when deformed even at red heat because of its high recrystallization temperature.
The resistance of metals to plastic deformation generally falls with temperature. For this reason, larger massive sections are always worked hot by forging, rolling, or extrusion. Metals display distinctly viscous characteristics at sufficiently high temperatures, and their resistance to flow increases at high forming rates. This occurs not only because it is a characteristic of viscous substances, but because the rate of recrystallization may not be fast enough.
Corrosion
Corrosion is the deterioration of a material due to interaction with its environment. It is the process in which metallic atoms leave the metal or form compounds in the presence of water and gases. Metal atoms are removed from a structural element until it fails, or oxides build up inside a pipe until it is plugged. All metals and alloys are subject to corrosion. Even the noble metals, such as gold, are subject to corrosive attack in some environments.
The corrosion of metals is a natural process. Most metals are not thermodynamically stable in the metallic form; they want to corrode and revert to the more stable forms that are normally found in ores, such as oxides. Corrosion is of primary concern in nuclear reactor plants. Corrosion occurs continuously throughout the reactor plant, and every metal is subject to it. Even though this corrosion cannot be eliminated, it can be controlled.
General Corrosion
General corrosion involving water and steel generally results from chemical action where the steel surface oxidizes, forming iron oxide (rust). Many of the systems and components in the plant are made from iron.
Some standard methods associated with material selection that protect against general corrosion include:
- The use of corrosion-resistant materials such as stainless steel and nickel, chromium, and molybdenum alloys. (Keep in mind that the corrosion is electrochemical by nature, and the corrosion resistance of the stainless steels results from surface oxide films that interfere with the electrochemical process.)
- The use of protective coatings such as paints and epoxies.
- The application of metallic and nonmetallic coatings or linings to the surface which protects against corrosion, but allows the material to retain its structural strength (for example, a carbon steel pressure vessel with stainless steel cladding as a liner).
Galvanic Corrosion
Galvanic corrosion occurs when two dissimilar metals with different potentials are placed in electrical contact in an electrolyte. It may also take place with one metal with heterogeneities (dissimilarities) (for example, impurity inclusions, grains of different sizes, difference in composition of grains, or differences in mechanical stress). A difference in electrical potential exists between the different metals and serves as the driving force for electrical current flow through the corrodant or electrolyte. This current results in corrosion of one of the metals. The larger the potential difference, the greater the probability of galvanic corrosion. Galvanic corrosion only causes deterioration of one of the metals. The less resistant, more active one becomes the anodic (negative) corrosion site. The stronger, more noble one is cathodic (positive) and protected. If there were no electrical contact, the two metals would be uniformly attacked by the corrosive medium. This would then be called general corrosion.
For any particular medium, a list can be made arranging metals sequentially from most active, or least noble, to passive, or most noble. The galvanic series for sea water is discussed in the Chemistry Fundamentals Handbook.
Galvanic corrosion is of particular concern in design and material selection. Material selection is important because different metals come into contact with each other and may form galvanic cells. Design is important to minimize differing flow conditions and resultant areas of corrosion buildup. Loose corrosion products are important because they can be transported to the reactor core and irradiated.
In some instances, galvanic corrosion can be helpful in the plant. For example, if pieces of zinc are attached to the bottom of a steel water tank, the zinc will become the anode, and it will corrode. The steel in the tank becomes the cathode, and it will not be effected by the corrosion. This technique is known as cathodic protection. The metal to be protected is forced to become a cathode, and it will corrode at a much slower rate than the other metal, which is used as a sacrificial anode.
Localized Corrosion
Localized corrosion is defined as the selective removal of metal by corrosion at small areas or zones on a metal surface in contact with a corrosive environment, usually a liquid. It usually takes place when small local sites are attacked at a much higher rate than the rest of the original surface. Localized corrosion takes place when corrosion works with other destructive processes such as stress, fatigue, erosion, and other forms of chemical attack. Localized corrosion mechanisms can cause more damage than any one of those destructive processes individually. There are many different types of localized corrosion. Pitting, stress corrosion cracking, chloride stress corrosion, caustic stress corrosion, primary side stress corrosion, heat exchanger tube denting, wastage, and intergranular attack corrosion are discussed in detail in the Chemistry Fundamentals Handbook.
Stress-Corrosion Cracking
One of the most serious metallurgical problems and one that is a major concern in the nuclear industry is stress-corrosion cracking (SCC). SCC is a type of intergranular attack corrosion that occurs at the grain boundaries under tensile stress. It tends to propagate as stress opens cracks that are subject to corrosion, which are then corroded further, weakening the metal by further cracking. The cracks can follow intergranular or transgranular paths, and there is often a tendency for crack branching.
The cracks form and propagate approximately at right angles to the direction of the tensile stresses at stress levels much lower than those required to fracture the material in the absence of the corrosive environment. As cracking penetrates further into the material, it eventually reduces the supporting cross section of the material to the point of structural failure from overload.
Stresses that cause cracking arise from residual cold work, welding, grinding, thermal treatment, or may be externally applied during service and, to be effective, must be tensile (as opposed to compressive).
SCC occurs in metals exposed to an environment where, if the stress was not present or was at much lower levels, there would be no damage. If the structure, subject to the same stresses, were in a different environment (noncorrosive for that material), there would be no failure. Examples of SCC in the nuclear industry are cracks in stainless steel piping systems and stainless steel valve stems.
The most effective means of preventing SCC: 1) designing properly; 2) reducing stress; 3) removing critical environmental species such as hydroxides, chlorides, and oxygen; 4) and avoiding stagnant areas and crevices in heat exchangers where chloride and hydroxide might become concentrated. Low alloy steels are less susceptible than high alloy steels, but they are subject to SCC in water containing chloride ions. Nickel-based alloys, however, are not effected by chloride or hydroxide ions.
An example of a nickel-based alloy that is resistant to stress-corrosion cracking is inconel. Inconel is composed of 72% nickel, 14-17% chromium, 6-10% iron, and small amounts of manganese, carbon, and copper.
Chloride Stress Corrosion
One of the most important forms of stress corrosion that concerns the nuclear industry is chloride stress corrosion. Chloride stress corrosion is a type of intergranular corrosion and occurs in austenitic stainless steel under tensile stress in the presence of oxygen, chloride ions, and high temperature.
It is thought to start with chromium carbide deposits along grain boundaries that leave the metal open to corrosion. This form of corrosion is controlled by maintaining low chloride ion and oxygen content in the environment and use of low carbon steels.
Caustic Stress Corrosion
Despite the extensive qualification of inconel for specific applications, a number of corrosion problems have arisen with inconel tubing. Improved resistance to caustic stress corrosion cracking can be given to inconel by heat treating it at 620°C to 705°C, depending upon prior solution treating temperature. Other problems that have been observed with inconel include wastage, tube denting, pitting, and intergranular attack.
Chapter 7: Hydrogen Embrittlement
Concern
Another form of stress-corrosion cracking is hydrogen embrittlement. Although embrittlement of materials takes many forms, hydrogen embrittlement in high strength steels has the most devastating effect because of the catastrophic nature of the fractures when they occur. Hydrogen embrittlement is the process by which steel loses its ductility and strength due to tiny cracks that result from the internal pressure of hydrogen (H2) or methane gas (CH4), which forms at the grain boundaries. In zirconium alloys, hydrogen embrittlement is caused by zirconium hydriding. At nuclear reactor facilities, the term “hydrogen embrittlement” generally refers to the embrittlement of zirconium alloys caused by zirconium hydriding.
Sources of Hydrogen
Sources of hydrogen causing embrittlement have been encountered in the making of steel, in processing parts, in welding, in storage or containment of hydrogen gas, and related to hydrogen as a contaminant in the environment that is often a by-product of general corrosion. It is the latter that concerns the nuclear industry. Hydrogen may be produced by corrosion reactions such as rusting, cathodic protection, and electroplating. Hydrogen may also be added to reactor coolant to remove oxygen from reactor coolant systems.
Hydrogen Embitterment of Stainless Steel
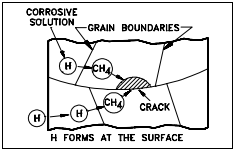
As shown in Figure 10, hydrogen diffuses along the grain boundaries and combines with the carbon (C), which is alloyed with the iron, to form methane gas. The methane gas is not mobile and collects in small voids along the grain boundaries where it builds up enormous pressures that initiate cracks. Hydrogen embrittlement is a primary reason that the reactor coolant is maintained at a neutral or basic pH in plants without aluminum components.
If the metal is under a high tensile stress, brittle failure can occur. At normal room temperatures, the hydrogen atoms are absorbed into the metal lattice and diffused through the grains, tending to gather at inclusions or other lattice defects. If stress induces cracking under these conditions, the path is transgranular. At high temperatures, the absorbed hydrogen tends to gather in the grain boundaries and stress-induced cracking is then intergranular. The cracking of martensitic and precipitation hardened steel alloys is believed to be a form of hydrogen stress corrosion cracking that results from the entry into the metal of a portion of the atomic hydrogen that is produced in the following corrosion reaction.
3 Fe + 4 H2O → Fe3O4 + 4 H2
Hydrogen embrittlement is not a permanent condition. If cracking does not occur and the environmental conditions are changed so that no hydrogen is generated on the surface of the metal, the hydrogen can rediffuse from the steel, so that ductility is restored.
To address the problem of hydrogen embrittlement, emphasis is placed on controlling the amount of residual hydrogen in steel, controlling the amount of hydrogen pickup in processing, developing alloys with improved resistance to hydrogen embrittlement, developing low or no embrittlement plating or coating processes, and restricting the amount of in-situ (in position) hydrogen introduced during the service life of a part.
Hydrogen Enbrittlement of Zirconium Alloys
Hydrogen embrittlement is a problem with zirconium and zirconium alloys, which often are used as cladding materials for nuclear reactors. Zirconium reacts with water as follows.
Zr + 2 H2O → ZrO2 + 2H2↑
Part of the hydrogen produced by the corrosion of zirconium in water combines with the zirconium to form a separate phase of zirconium hydride (ZrH1.5) platelets. The metal then becomes embrittled (ductility decreases) and it fractures easily. Cracks begin to form in the zirconium hydride platelets and are propagated through the metal. Zircaloy-2 (a zirconium alloy), which has been used as a fuel rod cladding, may absorb as much as 50% of the corrosionproduced hydrogen and is subject to hydrogen embrittlement, especially in the vicinity of the surface. Studies at Westinghouse, Batelle, and elsewhere have revealed that the nickel in the zircaloy-2 was responsible for the hydrogen pickup. This has led to the development of zircaloy- 4, which has significantly less nickel than zircaloy-2 and is less susceptible to embrittlement. In addition, the introduction of niobium into zircaloy-4 further reduces the amount of hydrogen absorption.