Chapter 1: Thermodynamics Properties
Mass and Weight
The mass (m) of a body is the measure of the amount of material present in that body. The
weight (wt) of a body is the force exerted by that body when its mass is accelerated in a
gravitational field. Mass and weight are related as shown in Equation 1-1.
wt = mg/gc (1-1)
where:
wt = weight (lbf)
m = mass (lbm)
g = acceleration of gravity = 32.17 ft/sec2
gc = gravitational constant = 32.17 lbm-ft/lbf-sec2
Note that gc has the same numerical value as the acceleration of gravity at sea level, but is not
the acceleration of gravity. Rather, it is a dimensional constant employed to facilitate the use of
Newton’s Second Law of Motion with the English system of units.
The weight of a body is a force produced when the mass of the body is accelerated by a
gravitational acceleration. The mass of a certain body will remain constant even if the
gravitational acceleration acting upon that body changes.
According to Newton’s Second Law of Motion, force (F) = ma, where a is acceleration. For example, on earth an object has a certain mass and a certain weight. When the same object is placed in outer space, away from the earth’s gravitational field, its mass is the same, but it is now in a “weightless” condition (that is, gravitational acceleration and, thus, force equal zero).
The English system uses the pound-force (lbf) as the unit of weight. Knowing that acceleration has the units of ft/sec2 and using Newton’s second law, we can determine that the units of mass are lbf-sec2 /ft. For simplification, 1 lbf-sec2 /ft is called a slug. The basic unit of mass in the English system is the slug. However, the slug is an almost meaningless unit for the average individual. The unit of mass generally used is the pound-mass (lbm). In order to allow lbm to be used as a unit of mass, we must divide Newton’s second law by the gravitational constant (gc).
Newton’s second law can be expressed by Equation 1-2.
F – ma/gc (1-2)
(32.17 lbm-ft /lbf-sec2 ) = gc
Use of the gravitational constant, gc, adapts Newton’s second law such that 1 lbf = 1 lbm at the surface of the earth. It is important to note that this relationship is only true at the surface of the earth, where the acceleration due to gravity is 32.17 ft/sec2 . However, because all of our discussions will be based upon experiences and observations on earth, we will use the lbm as the unit of mass.
NOTE: In Equation 1-2, acceleration “a” is often written as “g” because, in this case, the acceleration is the gravitational acceleration due to the earth’s gravitational field (g = 32.17 ft/sec2 ).
Specific Volume
The specific volume (ν) of a substance is the total volume (V) of that substance divided by the total mass (m) of that substance (volume per unit mass). It has units of cubic feet per pound-mass (ft3 /lbm).
ν – V/m (1-3)
where:
ν = specific volume (ft3 /lbm)
V = volume (ft3 )
m = mass (lbm)
Density
The density (ρ) of a substance is the total mass (m) of that substance divided by the total ρ volume (V) occupied by that substance (mass per unit volume). It has units of pound-mass per cubic feet (lbm/ft3 ). The density ( ) of a substance is the reciprocal of its specific volume (ν).
ρ – m/V – 1/ν (1-4)
where:
ρ = density (lbm/ft3 )
m = mass (lbm)
V = volume (ft3 )
ν = specific volume (ft3 /lbm)
Specific Gravity
Specific gravity (S.G.) is a measure of the relative density of a substance as compared to the density of water at a standard temperature. Physicists use 39.2°F (4°C) as the standard, but engineers ordinarily use 60°F. In the International System of Units (SI Units), the density of water is 1.00 g/cm3 at the standard temperature. Therefore, the specific gravity (which is dimensionless) for a liquid has the same numerical value as its density in units of g/cm3 . Since the density of a fluid varies with temperature, specific gravities must be determined and specified at particular temperatures.
Humidity
Humidity is the amount of moisture (water vapor) in the air. It can be expressed as absolute humidity or relative humidity. Absolute humidity is the mass of water vapor divided by a unit volume of air (grams of water/cm3 of air). Relative humidity is the amount of water vapor present in the air divided by the maximum amount that the air could contain at that temperature. Relative humidity is expressed as a percentage. The relative humidity is 100% if the air is saturated with water vapor and 0% if no water vapor is present in the air at all.
Intensive and Extensive Properties
Thermodynamic properties can be divided into two general classes, intensive and extensive properties. An intensive property is independent of the amount of mass. The value of an extensive property varies directly with the mass. Thus, if a quantity of matter in a given state is divided into two equal parts, each part will have the same value of intensive property as the original and half the value of the extensive property. Temperature, pressure, specific volume, and density are examples of intensive properties. Mass and total volume are examples of extensive properties.
Chapter 2: Temperature and Pressure Measurements
Temperature
Temperature is a measure of the molecular activity of a substance. The greater the movement
of molecules, the higher the temperature. It is a relative measure of how “hot” or “cold” a
substance is and can be used to predict the direction of heat transfer.
Temperature Scales
The two temperature scales normally employed for measurement purposes are the Fahrenheit (F)
and Celsius (C) scales. These scales are based on a specification of the number of increments
between the freezing point and boiling point of water at standard atmospheric pressure. The
Celsius scale has 100 units between these points, and the Fahrenheit scale has 180 units. The
zero points on the scales are arbitrary.
The freezing point of water was selected as the zero point of the Celsius scale. The coldest
temperature achievable with a mixture of ice and salt water was selected as the zero point of the
Fahrenheit scale. The temperature at which water boils was set at 100 on the Celsius scale and
212 on the Fahrenheit scale. The relationship between the scales is represented by the following
equations.
°F = 32.0 + (9/5)°C (1-5)
°C = (°F – 32.0)(5/9) (1-6)
It is necessary to define an absolute temperature scale having only positive values. The absolute
temperature scale that corresponds to the Celsius scale is called the Kelvin (K) scale, and the
absolute scale that corresponds to the Fahrenheit scale is called the Rankine (R) scale. The zero
points on both absolute scales represent the same physical state. This state is where there is no
molecular motion of individual atoms. The relationships between the absolute and relative
temperature scales are shown in the following equations.
°R = °F + 460 (1-7)
°K = °C + 273 (1-8)

The conversion of one temperature scale to another is sometimes required at nuclear facilities,
and the operator should be acquainted with the process. The following two examples will be
helpful.
Pressure
Pressure is a measure of the force exerted per unit area on the boundaries of a substance (or
system). It is caused by the collisions of the molecules of the substance with the boundaries of
the system. As molecules hit the walls, they exert forces that try to push the walls outward. The
forces resulting from all of these collisions cause the pressure exerted by a system on its
surroundings. Pressure is frequently measured in units of lbf/in2 (psi).
Pressure Scales
When pressure is measured relative to a perfect vacuum, it is called absolute pressure (psia);
when measured relative to atmospheric pressure (14.7 psi), it is called gauge pressure (psig). The
latter pressure scale was developed because almost all pressure gauges register zero when open
to the atmosphere. Therefore, pressure gauges measure the difference between the pressure of
the fluid to which they are connected and that of the surrounding air.
If the pressure is below that of the atmosphere, it is designated as a vacuum. A perfect vacuum
would correspond to absolute zero pressure. All values of absolute pressure are positive, because
a negative value would indicate tension, which is considered impossible in any fluid. Gauge
pressures are positive if they are above atmospheric pressure and negative if they are below
atmospheric pressure. Figure 2 shows the relationships between absolute, gauge, vacuum, and
atmospheric pressures, as do Equations 1-9 and 1-10.

Pabs = Patm + Pgauge (1-9)
Pabs = Patm – Pvac (1-10)
Patm is atmospheric pressure, which is also called the barometric pressure. Pgauge is the gauge
pressure, and Pvac is vacuum. Once again, the following examples relating the various pressures
will be helpful in understanding the idea of gauge versus absolute pressures.
In addition to pounds per square inch, pressure can be measured with reference to the force that
exists in a column of fluid at a certain height. The most common of these are inches of water,
inches of mercury, millimeters of mercury, and microns of mercury. Conversion factors are listed
below.
14.7 psia = 408 inches of water
14.7 psia = 29.9 inches of mercury
1 inch of mercury = 25.4 millimeters of mercury
1 millimeter of mercury = 103 microns of mercury
Chapter 3: Energy, Work, and Heat
Energy
Energy is defined as the capacity of a system to perform work or produce heat. Potential Energy Potential energy (PE) is defined as the energy of position. Using English system units, it is defined by Equation 1-11.
Potential Energy
Potential energy (PE) is defined as the energy of position. Using English system units, it is
defined by Equation 1-11.
PE – mgz/gc (1-11)
where:
PE = potential energy (ft-lbf)
m = mass (lbm) z = height above some reference level (ft)
g = acceleration due to gravity (ft/sec2)
gc = gravitational constant = 32.17 ft-lbm/lbf-sec2
In most practical engineering calculations, the acceleration due to gravity (g) is numerically equal to the gravitational constant (gc); thus, the potential energy (PE) in foot-pounds-force is numerically equal to the product of the mass (m) in pounds-mass times the height (z) in feet above some reference level.
Kinetic Energy
Kinetic energy (KE) is the energy of motion. Using English system units, it is defined by Equation 1-12.
KE – mv2/2gc (1-12)
where:
KE = kinetic energy (ft-lbf)
m = mass (lbm)
v = velocity (ft/sec)
gc = gravitational constant = 32.17 ft-lbm/lbf-sec2
Specific Internal Energy
Potential energy and kinetic energy are macroscopic forms of energy. They can be visualized in terms of the position and the velocity of objects. In addition to these macroscopic forms of energy, a substance possesses several microscopic forms of energy. Microscopic forms of energy include those due to the rotation, vibration, translation, and interactions among the molecules of a substance. None of these forms of energy can be measured or evaluated directly, but techniques have been developed to evaluate the change in the total sum of all these microscopic forms of energy. These microscopic forms of energy are collectively called internal energy, customarily represented by the symbol U. In engineering applications, the unit of internal energy is the British thermal unit (Btu), which is also the unit of heat. The specific internal energy (u) of a substance is its internal energy per unit mass. It equals the total internal energy (U) divided by the total mass (m).
u – U/m (1-13)
where:
u = specific internal energy (Btu/lbm)
U = internal energy (Btu)
m = mass (lbm)
Specific P-V Energy
In addition to the internal energy (U), another form of energy exists that is important in understanding energy transfer systems. This form of energy is called P-V energy because it arises from the pressure (P) and the volume (V) of a fluid. It is numerically equal to PV, the product of pressure and volume. Because energy is defined as the capacity of a system to perform work, a system where pressure and volume are permitted to expand performs work on its surroundings. Therefore, a fluid under pressure has the capacity to perform work. In engineering applications, the units of P-V energy, also called flow energy, are the units of pressure times volume (pounds-force per square foot times cubic feet), which equals foot-pounds force (ft-lbf).
The specific P-V energy of a substance is the P-V energy per unit mass. It equals the total P-V divided by the total mass m, or the product of the pressure P and the specific volume ν, and is written as Pν.
Pν – PV/m (1-14)
where:
P = pressure (lbf/ft2 )
V = volume (ft3 )
ν = specific volume (ft3 /lbm) – V/m
m = mass (lbm)
Specific Enthalpy
Specific enthalpy (h) is defined as h=u+Pν, where u is the specific internal energy (Btu/lbm) of the system being studied, P is the pressure of the system (lbf/ft2 ), and ν is the specific volume (ft3 /lbm) of the system. Enthalpy is usually used in connection with an “open” system problem in thermodynamics. Enthalpy is a property of a substance, like pressure, temperature, and volume, but it cannot be measured directly. Normally, the enthalpy of a substance is given with respect to some reference value. For example, the specific enthalpy of water or steam is given using the reference that the specific enthalpy of water is zero at .01°C and normal atmospheric pressure. The fact that the absolute value of specific enthalpy is unknown is not a problem, however, because it is the change in specific enthalpy (∆h) and not the absolute value that is important in practical problems. Steam tables include values of enthalpy as part of the information tabulated.
Work
Kinetic energy, potential energy, internal energy, and P-V energy are forms of energy that are properties of a system. Work is a form of energy, but it is energy in transit. Work is not a property of a system. Work is a process done by or on a system, but a system contains no work. This distinction between the forms of energy that are properties of a system and the forms of energy that are transferred to and from a system is important to the understanding of energy transfer systems.
Work is defined for mechanical systems as the action of a force on an object through a distance. It equals the product of the force (F) times the displacement (d).
W = F d (1-15)
where:
W = work (ft-lbf)
F = force (lbf)
d = displacement (ft)
In dealing with work in relation to energy transfer systems, it is important to distinguish between work done by the system on its surroundings and work done on the system by its surroundings. Work is done by the system when it is used to turn a turbine and thereby generate electricity in a turbine-generator. Work is done on the system when a pump is used to move the working fluid from one location to another. A positive value for work indicates that work is done by the system on its surroundings; a negative value indicates that work is done on the system by its surroundings.
Heat
Heat, like work, is energy in transit. The transfer of energy as heat, however, occurs at the molecular level as a result of a temperature difference. The symbol Q is used to denote heat. In engineering applications, the unit of heat is the British thermal unit (Btu). Specifically, this is called the 60 degree Btu because it is measured by a one degree temperature change from 59.5 to 60.5°F.
As with work, the amount of heat transferred depends upon the path and not simply on the initial and final conditions of the system. Also, as with work, it is important to distinguish between heat added to a system from its surroundings and heat removed from a system to its surroundings. A positive value for heat indicates that heat is added to the system by its surroundings. This is in contrast to work that is positive when energy is transferred from the system and negative when transferred to the system. The symbol q is sometimes used to indicate the heat added to or removed from a system per unit mass. It equals the total heat (Q) added or removed divided by the mass (m). The term “specific heat” is not used for q since specific heat is used for another parameter. The quantity represented by q is referred to simply as the heat transferred per unit mass.
q – Q / m (1-16)
where:
q = heat transferred per unit mass (Btu/lbm)
Q = heat transferred (Btu)
m = mass (lbm)
The best way to quantify the definition of heat is to consider the relationship between the amount of heat added to or removed from a system and the change in the temperature of the system. Everyone is familiar with the physical phenomena that when a substance is heated, its temperature increases, and when it is cooled, its temperature decreases. The heat added to or removed from a substance to produce a change in its temperature is called sensible heat. The units of heat are often defined in terms of the changes in temperature it produces.
Another type of heat is called latent heat. Latent heat is the amount of heat added to or removed from a substance to produce a change in phase. When latent heat is added, no temperature change occurs. There are two types of latent heat. The first is the latent heat of fusion. This is the amount of heat added or removed to change phase between solid and liquid. The second type of latent heat is the latent heat of vaporization. This is the amount of heat added or removed to change phase between liquid and vapor. The latent heat of vaporization is sometimes called the latent heat of condensation.
Different substances are affected to different magnitudes by the addition of heat. When a given amount of heat is added to different substances, their temperatures increase by different amounts. The ratio of the heat (Q) added to or removed from a substance to the change in temperature (∆T) produced is called the heat capacity (Cp) of the substance. The heat capacity of a substance per unit mass is called the specific heat (cp) of the substance. The subscript p indicates that the heat capacity and specific heat apply when the heat is added or removed at constant pressure.
Cp – Q / ∆T (1-17)
cp – Q / m∆T
cp – q / ∆T
where:
Cp = heat capacity at constant pressure (Btu/°F)
cp = specific heat at constant pressure (Btu/lbm-°F)
Q = heat transferred (Btu)
q = heat transferred per unit mass (Btu/lbm) m = mass (lbm)
∆T = temperature change (°F)
One lbm of water is raised 1°F and one Btu of heat is added. This implies that the specific heat (cp) of water is one Btu/lbm-°F. The cp of water is equal to one Btu/lbm-°F only at 39.1°F.
By rearranging Equation 1-17 we obtain Q = mcp∆T, which is used to calculate latent heat. By substituting mass flow rate in lbm/hr, , for m, we obtain . This equation is used m˙ Q˙ mc˙ p ∆T to calculate heat transfer in Btu/hr and will be useful in later chapters.
From the previous discussions on heat and work, it is evident that there are many similarities between them. Heat and work are both transient phenomena. Systems never possess heat or work, but either or both may occur when a system undergoes a change of energy state. Both heat and work are boundary phenomena in that both are observed at the boundary of the system. Both represent energy crossing the system boundary.
Entropy
Entropy (S) is a property of a substance, as are pressure, temperature, volume, and enthalpy. Because entropy is a property, changes in it can be determined by knowing the initial and final conditions of a substance. Entropy quantifies the energy of a substance that is no longer available to perform useful work. Because entropy tells so much about the usefulness of an amount of heat transferred in performing work, the steam tables include values of specific entropy (s = S/m) as part of the information tabulated. Entropy is sometimes referred to as a measure of the inability to do work for a given heat transferred. Entropy is represented by the letter S and can be defined as ∆S in the following relationships.
∆S – ∆Q / Tabs (1-18)
∆s – ∆q / Tabs (1-19)
where:
∆S = the change in entropy of a system during some process (Btu/°R)
∆Q = the amount of heat transferred to or from the system during the process (Btu)
Tabs = the absolute temperature at which the heat was transferred (°R)
∆s = the change in specific entropy of a system during some process (Btu/lbm -o R)
∆q = the amount of heat transferred to or from the system during the process (Btu/lbm)
Like enthalpy, entropy cannot be measured directly. Also, like enthalpy, the entropy of a substance is given with respect to some reference value. For example, the specific entropy of water or steam is given using the reference that the specific entropy of water is zero at 32°F. The fact that the absolute value of specific entropy is unknown is not a problem because it is the change in specific entropy (∆s) and not the absolute value that is important in practical problems.
Energy and Power Equivalences
The various forms of energy involved in energy transfer systems (such as potential energy, kinetic energy, internal energy, P-V energy, work and heat) may be measured in numerous basic units. In general, three types of units are used to measure energy: (1) mechanical units, such as the foot-pound-force (ft-lbf); (2) thermal units, such as the British thermal unit (Btu); and (3) electrical units, such as the watt-second (W-sec). In the mks and cgs systems, the mechanical units of energy are the joule (j) and the erg, the thermal units are the kilocalorie (kcal) and the calorie (cal), and the electrical units are the watt-second (W-sec) and the erg. Although the units of the various forms of energy are different, they are equivalent.
Some of the most important experiments in science were those conducted by J. P. Joule in 1843, who showed quantitatively that there was a direct correspondence between mechanical and thermal energy. These experiments showed that one kilocalorie equals 4,186 joules. These same experiments, when performed using English system units, show that one British thermal unit (Btu) equals 778.3 ft-lbf. These experiments established the equivalence of mechanical and thermal energy. Other experiments established the equivalence of electrical energy with both mechanical and thermal energy. For engineering applications, these equivalences are expressed by the following relationships.
1 ft-lbf = 1.286 x 10⁻³ Btu = 3.766 x 10⁻⁷ kW-hr
1 Btu = 778.3 ft-lbf = 2.928 x 10⁻⁴ kW-hr
1 kW-hr = 3.413 x 10³ Btu = 2.655 x 106 ft-lbf
There is one additional unit of energy encountered in engineering applications. It is the horsepower-hour (hp-hr). It is a mechanical unit of energy defined by the following relationship:
1 hp-hr = 1.980 x 106 ft-lbf
These relationships can be used to convert between the various English system units for the various forms of energy.
Most computations involving the energy of the working fluid in an energy transfer system are performed in Btu’s. Forms of mechanical energy (such as potential energy, kinetic energy, and mechanical work) and other forms of energy (such as P-V energy) are usually given in foot-pounds-force. These are converted to Btu’s by using 1 Btu = 778.3 ft-lbf.
This conversion factor is often used. In fact, a constant called the mechanical equivalent of heat, usually denoted by the symbol J and sometimes referred to as Joule’s constant, is defined as:
J – 778 ft lbf / Btu
Power is defined as the time rate of doing work. It is equivalent to the rate of the energy transfer. Power has units of energy per unit time. As with energy, power may be measured in numerous basic units, but the units are equivalent. In the English system, the mechanical units of power are foot-pounds-force per second or per hour (ft-lbf/sec or ft-lbf/hr) and horsepower (hp). The thermal units of power are British thermal units per hour (Btu/hr), and the electrical units of power are watts (W) or kilowatts (kW). For engineering applications, the equivalence of these units is expressed by the following relationships.
1 ft-lbf/sec = 4.6263 Btu/hr = 1.356 x 10⁻³ kW
1 Btu/hr = 0.2162 ft-lbf/sec = 2.931 x 10⁻⁴ kW
1 kW = 3.413 x 10³ Btu/hr = 737.6 ft-lbf/sec
Horsepower is related to foot-pounds-force per second (ft-lbf/sec) by the following relationship:
1 hp = 550.0 ft-lbf/sec
These relationships can be used to convert the English system units for power.
Chapter 4: Thermodynamic Systems and Processess
Thermodynamic Systems and Surroundings
Thermodynamics involves the study of various systems. A system in thermodynamics is nothing more than the collection of matter that is being studied. A system could be the water within one side of a heat exchanger, the fluid inside a length of pipe, or the entire lubricating oil system for a diesel engine. Determining the boundary to solve a thermodynamic problem for a system will depend on what information is known about the system and what question is asked about the system.
Everything external to the system is called the thermodynamic surroundings, and the system is separated from the surroundings by the system boundaries. These boundaries may either be fixed or movable. In many cases, a thermodynamic analysis must be made of a device, such as a heat exchanger, that involves a flow of mass into and/or out of the device. The procedure that is followed in such an analysis is to specify a control surface, such as the heat exchanger tube walls. Mass, as well as heat and work (and momentum), may flow across the control surface.
Types of Thermodynamic Systems
Systems in thermodynamics are classified as isolated, closed, or open based on the possible transfer of mass and energy across the system boundaries. An isolated system is one that is not influenced in any way by the surroundings. This means that no energy in the form of heat or work may cross the boundary of the system. In addition, no mass may cross the boundary of the system.
A thermodynamic system is defined as a quantity of matter of fixed mass and identity upon which attention is focused for study. A closed system has no transfer of mass with its surroundings, but may have a transfer of energy (either heat or work) with its surroundings.
An open system is one that may have a transfer of both mass and energy with its surroundings.
Thermodynamic Equilibrium
When a system is in equilibrium with regard to all possible changes in state, the system is in thermodynamic equilibrium. For example, if the gas that comprises a system is in thermal equilibrium, the temperature will be the same throughout the entire system.
Control Volume
A control volume is a fixed region in space chosen for the thermodynamic study of mass and energy balances for flowing systems. The boundary of the control volume may be a real or imaginary envelope. The control surface is the boundary of the control volume.
Steady State
Steady state is that circumstance in which there is no accumulation of mass or energy within the control volume, and the properties at any point within the system are independent of time.
Thermodynamic Process
Whenever one or more of the properties of a system change, a change in the state of the system occurs. The path of the succession of states through which the system passes is called the thermodynamic process. One example of a thermodynamic process is increasing the temperature of a fluid while maintaining a constant pressure. Another example is increasing the pressure of a confined gas while maintaining a constant temperature. Thermodynamic processes will be discussed in more detail in later chapters.
Cyclic Process
When a system in a given initial state goes through a number of different changes in state (going through various processes) and finally returns to its initial values, the system has undergone a cyclic process or cycle. Therefore, at the conclusion of a cycle, all the properties have the same value they had at the beginning. Steam (water) that circulates through a closed cooling loop undergoes a cycle.
Reversible Process
A reversible process for a system is defined as a process that, once having taken place, can be reversed, and in so doing leaves no change in either the system or surroundings. In other words the system and surroundings are returned to their original condition before the process took place. In reality, there are no truly reversible processes; however, for analysis purposes, one uses reversible to make the analysis simpler, and to determine maximum theoretical efficiencies. Therefore, the reversible process is an appropriate starting point on which to base engineering study and calculation.
Although the reversible process can be approximated, it can never be matched by real processes. One way to make real processes approximate reversible process is to carry out the process in a series of small or infinitesimal steps. For example, heat transfer may be considered reversible if it occurs due to a small temperature difference between the system and its surroundings. For example, transferring heat across a temperature difference of 0.00001 °F “appears” to be more reversible than for transferring heat across a temperature difference of 100 °F. Therefore, by cooling or heating the system in a number of infinitesamally small steps, we can approximate a reversible process. Although not practical for real processes, this method is beneficial for thermodynamic studies since the rate at which processes occur is not important.
Irreversible Process
An irreversible process is a process that cannot return both the system and the surroundings to their original conditions. That is, the system and the surroundings would not return to their original conditions if the process was reversed. For example, an automobile engine does not give back the fuel it took to drive up a hill as it coasts back down the hill.
There are many factors that make a process irreversible. Four of the most common causes of irreversibility are friction, unrestrained expansion of a fluid, heat transfer through a finite temperature difference, and mixing of two different substances. These factors are present in real, irreversible processes and prevent these processes from being reversible.
Adiabatic Process
An adiabatic process is one in which there is no heat transfer into or out of the system. The system can be considered to be perfectly insulated.
Isentropic Process
An isentropic process is one in which the entropy of the fluid remains constant. This will be true if the process the system goes through is reversible and adiabatic. An isentropic process can also be called a constant entropy process.
Polytropic Process
When a gas undergoes a reversible process in which there is heat transfer, the process frequently takes place in such a manner that a plot of the Log P (pressure) vs. Log V (volume) is a straight line. Or stated in equation form PVn = a constant. This type of process is called a polytropic process. An example of a polytropic process is the expansion of the combustion gasses in the cylinder of a water-cooled reciprocating engine.
Throttling Process
A throttling process is defined as a process in which there is no change in enthalpy from state one to state two, h1 = h2; no work is done, W = 0; and the process is adiabatic, Q = 0. To better understand the theory of the ideal throttling process let’s compare what we can observe with the above theoretical assumptions.
An example of a throttling process is an ideal gas flowing through a valve in midposition. From experience we can observe that: Pin > Pout, velin < velout (where P = pressure and vel = velocity). These observations confirm the theory that hin = hout. Remember h = u + Pv (v = specific volume), so if pressure decreases then specific volume must increase if enthalpy is to remain constant (assuming u is constant). Because mass flow is constant, the change in specific volume is observed as an increase in gas velocity, and this is verified by our observations.
The theory also states W = 0. Our observations again confirm this to be true as clearly no “work” has been done by the throttling process. Finally, the theory states that an ideal throttling process is adiabatic. This cannot clearly be proven by observation since a “real” throttling process is not ideal and will have some heat transfer.
Chapter 5: Change of Phase
Classification of Properties
As discussed earlier in this module, properties are classified as either intensive or extensive. Properties are intensive if independent of the amount of mass present and extensive if a function of the amount of mass present. Properties such as pressure, temperature, and density are intensive, whereas volume and mass are extensive. An extensive property may be made intensive by dividing the particular property by the total mass. Total volume (V), which is an extensive property, can be changed to specific volume, which is an intensive property, by dividing by the mass of the system, ν = V/m. Any specific property (specific volume, specific enthalpy, specific entropy), is an intensive property, as indicated in Figure 3.
The use of intensive and extensive properties is demonstrated in the following discussion. Consider as a system 1 lbm of water contained in the piston-cylinder arrangement of Figure 4. Suppose that the piston and weight maintain a pressure of 14.7 psia in the cylinder and that the initial temperature is 60°F, part (a) of Figure 4. As heat is transferred to the water, the temperature increases. The specific volume increases slightly, and the pressure remains constant. When the temperature reaches 212°F, additional heat transfer results in a change in phase (boiling), as indicated in part (b).
That is, some of the liquid becomes vapor and both the temperature and pressure remain constant, but the specific volume increases considerably. When the last drop of liquid is vaporized, further transfer of heat results in an increase in both temperature and specific volume of the vapor, part (c). In this example, temperature and pressure are intensive, and therefore do not depend upon the amount of mass present. By examining the specific volume (an intensive property) of the water in the piston instead of the volume (an extensive property), we can examine how any portion of the water in the piston changes. Volume by itself tells us nothing about the water in the piston. However, by knowing the specific volume we can tell if the water is a liquid or steam.

Saturation
Figure 5 Vapor Pressure Curve The term saturation defines a condition in which a mixture of vapor and liquid can exist together at a given temperature and pressure. The temperature at which vaporization (boiling) starts to occur for a given pressure is called the saturation temperature or boiling point. The pressure at which vaporization (boiling) starts to occur for a given temperature is called the saturation pressure. For water at 212°F, the saturation pressure is 14.7 psia and, for water at 14.7 psia, the saturation temperature is 212°F. For a pure substance there is a definite relationship between saturation pressure and saturation temperature. The higher the pressure, the higher the saturation temperature. The graphical representation of this relationship between temperature and pressure at saturated conditions is called the vapor pressure curve. A typical vapor pressure curve is shown in Figure 5. The vapor/liquid mixture is at saturation when the conditions of pressure and temperature fall on the curve.

Saturated and Subcooled Liquids
If a substance exists as a liquid at the saturation temperature and pressure, it is called a saturated liquid.
If the temperature of the liquid is lower than the saturation temperature for the existing pressure, it is called either a subcooled liquid (implying that the temperature is lower than the saturation temperature for the given pressure) or a compressed liquid (implying that the pressure is greater than the saturation pressure for the given temperature). Both terms have the same meaning, so either term may be used.
Quality
When a substance exists as part liquid and part vapor at saturation conditions, its quality (x) is defined as the ratio of the mass of the vapor to the total mass of both vapor and liquid. Thus, if the mass of vapor is 0.2 lbm and the mass of the liquid is 0.8 lbm, the quality is 0.2 or 20%. Quality is an intensive property. Quality has meaning when the substance is in a saturated state only, at saturation pressure and temperature. The area under the bell-shaped curve on figure 6 shows the region in which quality is important.
x= m vapor/(m liquid + m vapor)

Moisture Content
The moisture content of a substance is the opposite of its quality. Moisture (M) is defined as the ratio of the mass of the liquid to the total mass of both liquid and vapor. The moisture of the mixture in the previous paragraph would be 0.8 or 80%. The following equations show how to calculate the moisture of a mixture and the relationship between quality and moisture.
M = mliquid/ ( mliquid + mvapor) (1-21)
M = 1 – x
Saturated and Superheated Vapors
If a substance exists entirely as vapor at saturation temperature, it is called saturated vapor. Sometimes the term dry saturated vapor is used to emphasize that the quality is 100%. When the vapor is at a temperature greater than the saturation temperature, it is said to exist as superheated vapor. The pressure and temperature of superheated vapor are independent properties, since the temperature may increase while the pressure remains constant. Actually, the substances we call gases are highly superheated vapors.
Constant Pressure Heat Addition
Consider the plot on the Figure 7 T-V Diagram temperature-volume diagram of Figure 7, viewing the constant-pressure line that represents the states through which the water of the previous discussion passes as it is heated from the initial state of 14.7 psia and 60°F. Let state A represent the initial state and state B represent the start of the saturated liquid line (212°F). Therefore, line AB represents the process in which the liquid is heated from the initial temperature to the saturation temperature
Point C is the saturated vapor state, and line BC is the constant-temperature process in which the change of phase from liquid to vapor occurs. Line CD represents the process in which the steam is super-heated at constant pressure. Temperature and volume both increase during the process.
Now let the process take place at a constant pressure of 100 psia, beginning from an initial temperature of 60°F. Point E represents the initial state, the specific volume being slightly less than 14.7 psia and 60°F. Vaporization now begins at point F, where the temperature is 327.8°F. Point G is the saturated-vapor state, and line GH is the constant-pressure process in which the steam is superheated.
In a similar manner, a constant pressure of 1000 psia is represented by line IJKL, the saturation temperature being 544.6°F.
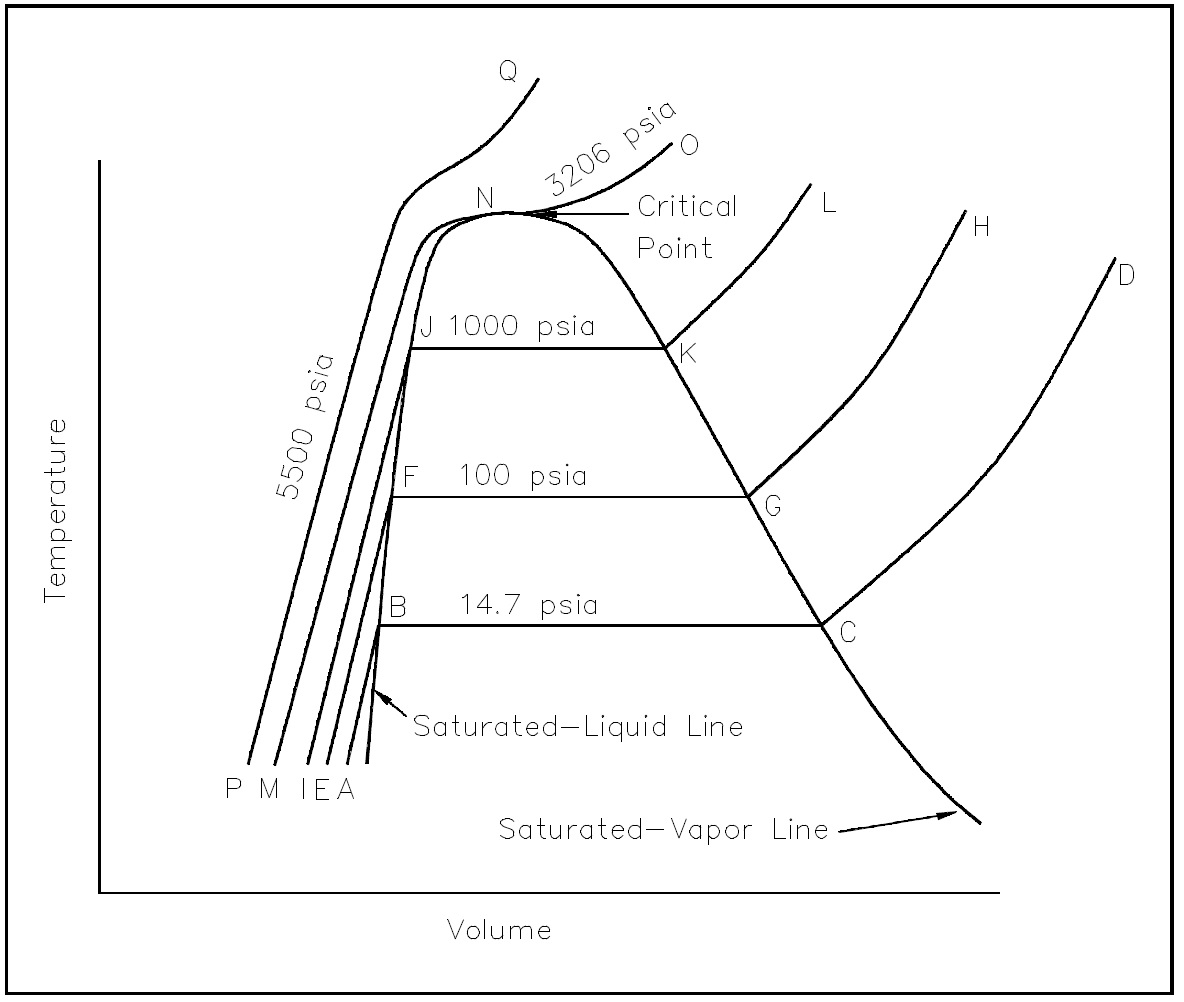
Critical Point
At a pressure of 3206.2 psia, represented by line MNO, there is no constant-temperature vaporization process. Rather, point N is a point of inflection, with the slope being zero. This point is called the critical point, and at the critical point the saturated-liquid and saturated-vapor states are identical. The temperature, pressure, and specific volume at the critical point are called the critical temperature, critical pressure, and critical volume.
A constant pressure process greater than the critical pressure is represented by line PQ. There is no definite change in phase from liquid to vapor and no definite point at which there is a change from the liquid phase to the vapor phase. For pressures greater than the critical pressure, the substance is usually called a liquid when the temperature is less than the critical temperature (705.47°F) and a vapor or gas when the temperature is greater than the critical temperature. In the figure, line NJFB represents the saturated liquid line, and the line NKGC represents the saturated vapor line.
Fusion
Consider one further experiment with the piston-cylinder arrangement of Figure 4. Suppose the cylinder contained 1 lbm of ice at 0°F, 14.7 psia. When heat is transferred to the ice, the pressure remains constant, the specific volume increases slightly, and the temperature increases until it reaches 32°F, at which point the ice melts while the temperature remains constant. In this state the ice is called a saturated solid. For most substances, the specific volume increases during this melting process, but for water the specific volume of the liquid is less than the specific volume of the solid. This causes ice to float on water. When all the ice is melted, any further heat transfer causes an increase in temperature of the liquid. The process of melting is also referred to as fusion. The heat added to melt ice into a liquid is called the latent heat of fusion.
Sublimation
If the initial pressure of the ice at 0°F is 0.0505 psia, heat transfer to the ice first results in an increase in temperature to 20°F. At this point, however, the ice passes directly from the solid phase to the vapor phase in the process known as sublimation. Sublimation is a special term used for cases in which the transition between the solid phase and the vapor phase occurs directly, without passing through the liquid phase. Further heat transfer would result in superheating the vapor.
Triple Point
Finally, consider an initial pressure of the ice of 0.08854 psia. Again, as a result of heat transfer, the temperature will increase until it reaches 32°F. At this point, however, further heat transfer may result in some of the ice becoming vapor and some becoming liquid because it is possible to have the three phases in equilibrium. This is called the triple point, defined as the state in which all three phases may be present in equilibrium.
Figure 8 is a pressure-temperature diagram for water that shows how the solid, liquid, and vapor phases may exist together in equilibrium. Along the sublimation line, the solid and vapor phases are in equilibrium, along the fusion line, the solid and liquid phases are in equilibrium; and along the vaporization line, the liquid and vapor phases are in equilibrium. The only point at which all three phases may exist in equilibrium is the triple point. The temperature and pressure for the triple point of water are 32.02°F and 0.08865 psia. The vaporization line ends at the critical point because there is no distinct change from the liquid phase to the vapor phase above the critical point.

Condensation
All the processes discussed on the preceding pages (vaporization, sublimation, and fusion) occur during a heat addition to a substance. If heat is removed from a substance, the opposite of the described processes will occur.
As previously described, a heat addition at a constant pressure to a saturated liquid will cause the liquid to evaporate (change phase from liquid to vapor). If heat is removed at a constant pressure from a saturated vapor, condensation will occur and the vapor will change phase to liquid.
So the processes of vaporization and condensation are the exact opposite of each other. Similarly, freezing is the opposite process of melting and fusion. Sublimation also has an opposite process in which a gas goes directly to solid, but this process is not normally referred to with a unique term.
Chapter 6: Property Diagrams and Steam Tables
Property Diagrams
The phases of a substance and the relationships between its properties are most commonly shown on property diagrams. A large number of different properties have been defined, and there are some dependencies between properties. For example, at standard atmospheric pressure and temperature above 212°F, water exists as steam and not a liquid; it exists as a liquid at temperatures between 32°F and 212°F; and, it exists as ice at temperatures below 32°F. In addition, the properties of ice, water, and steam are related. Saturated steam at 212°F and standard atmospheric pressure has a specific volume of 26.8 ft3 /lbm. At any other temperature and pressure, saturated steam has a different specific volume. For example, at 544°F and 1000 psia pressure, its specific volume is 0.488 ft3 /lbm.
There are five basic properties of a substance that are usually shown on property diagrams. These are: pressure (P), temperature (T), specific volume (ν), specific enthalpy (h), and specific entropy (s). When a mixture of two phases, such as water and steam, is involved, a sixth property, quality (x), is also used.
There are six different types of commonly encountered property diagrams. These are: PressureTemperature (P-T) diagrams, Pressure-Specific Volume (P-ν) diagrams, Pressure-Enthalpy (P-h) diagrams, Enthalpy-Temperature (h-T) diagrams, Temperature-entropy (T-s) diagrams, and Enthalpy-Entropy (h-s) or Mollier diagrams.
Pressure-Temperature (P-T) Diagram
A P-T diagram is the most common way to show the phases of a substance. Figure 9 is the P-T diagram for pure water. A P-T diagram can be constructed for any pure substance. The line that separates the solid and vapor phases is called the sublimation line. The line that separates the solid and liquid phases is called the fusion line. The line that separates the liquid and vapor phases is called the vaporization line. The point where the three lines meet is called the triple point. The triple point is the only point at which all three phases can exist in equilibrium. The point where the vaporization line ends is called the critical point. At temperatures and pressures greater than those at the critical point, no substance can exist as a liquid no matter how great a pressure is exerted upon it.

Pressure-Specific Volume (P-ν) Diagram
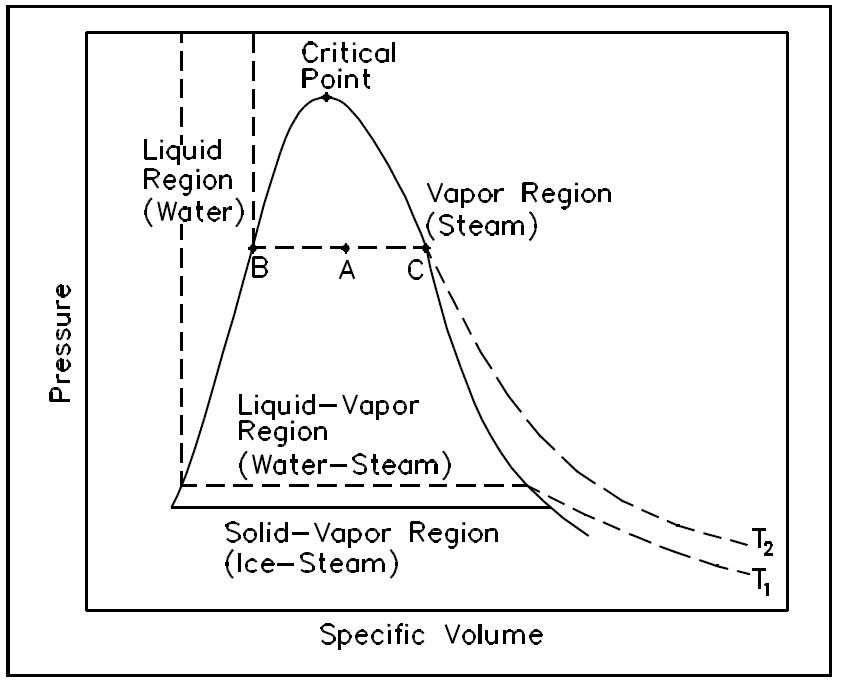
A P-ν diagram is another common Figure 10 P-v Diagram for Water type of property diagram. Figure 10 is the P-ν diagram for pure water. A P-ν diagram can be constructed for any pure substance. A P-ν diagram is different from a P-T diagram in one particularly important way. There are regions on a P-ν diagram in which two phases exist together.
In the liquid-vapor region in Figure 10, water and steam exist together. For example, at point A, water with a specific volume (νf ), given by point B, exists together with steam with a specific volume (νg), given by point C. The dotted lines on Figure 10 are lines of constant temperature. The quality of the mixture at any point in the liquid-vapor region can be found because the specific volumes of water, steam, and the mixture are all known. The quality can be found using the following relationship.
ν = xνg + (1 – x)νf
x = (ν-νf/νg-νf ) = (ν νf/ νfg )
where:
ν = specific volume of the mixture (ft3 /lbm)
x = quality of the mixture (no units)
νg = specific volume of the vapor (ft3 /lbm)
νf = specific volume of the liquid (ft3 /lbm)
νfg = specific volume change of vaporization (ft3 /lbm) or vfg = vg – vf
Pressure-Enthalpy (P-h) Diagram
A P-h diagram exhibits the same Figure 11 P-h Diagram for Water features as a P-ν diagram. Figure 11 is the P-h diagram for pure water. A P-h diagram can be constructed for any pure substance. Like the P-ν diagram, there are regions on a P-h diagram in which two phases exist together. In the liquid-vapor region in Figure 11, water and steam exist together. For example, at point A, water with an enthalpy (hf ), given by point B, exists together with steam with an enthalpy (hg), given by point C. The quality of the mixture at any point in the liquid-vapor region can be found using the following relationship.
h = xhg + (1 – x)hf
x = (h – hf ) / hfg
where:
h = specific enthalpy of the mixture (Btu/lbm)
x = quality of the mixture (no units)
hg = specific enthalpy of the saturated vapor (Btu/lbm)
hf = specific enthalpy of the saturated liquid (Btu/lbm)
hfg = specific enthalpy change of vaporization (Btu/lbm) or hfg = hg – hf

Enthalpy-Temperature (h-T) Diagram
An h-T diagram exhibits the same features as on the previous property diagrams. Figure 12 is the h-T diagram for pure water. An h-T diagram can be constructed for any pure substance. As in the previous property diagrams, there are regions on the h-T diagram in which two phases exist together. The region between the saturated liquid line and the saturated vapor line represents the area of two phases existing at the same time. The vertical distance between the two saturation lines represents the latent heat of vaporization. If pure water existed at point A on the saturated liquid line and an amount of heat was added equal to the latent heat of vaporization, then the water would change phase from a saturated liquid to a saturated vapor (point B), while maintaining a constant temperature. As shown in Figure 12, operation outside the saturation lines results in a subcooled liquid or superheated steam.

The quality of the mixture at any point in the liquid-vapor region can be found using the same relationship as shown for the P-h diagram.
x = h – hf / hfg
Temperature-Entroy (T-s) Diagram
A T-s diagram is the type of diagram most frequently used to analyze energy transfer system cycles. This is because the work done by or on the system and the heat added to or removed from the system can be visualized on the T-s diagram. By the definition of entropy, the heat transferred to or from a system equals the area under the T-s curve of the process. Figure 13 is the T-s diagram for pure water. A T-s diagram can be constructed for any pure substance. It exhibits the same features as P-υ diagrams.

In the liquid-vapor region in Figure 13, water and steam exist together. For example, at point A, water with an entropy (sf ) given by point B, exists together with steam with an entropy (sg) given by point C. The quality of the mixture at any point in the liquid-vapor region can be found using the following relationship.
s = xsg + (1 – x)sf
x = (s-sf )/sfg
where:
s = specific entropy of the mixture (Btu/lbm-°R)
x = quality of the mixture (no units)
sg = specific entropy of the saturated vapor (Btu/lbm-°R)
sf = specific entropy of the saturated liquid (Btu/lbm-°R)
sfg = specific entropy change of vaporization (Btu/lbm-°R) or sfg = sg – sf
Enthalpy-Entropy (h-s) or Mollier Diagram
The Mollier diagram, shown in Figure 14, is a chart on which enthalpy (h) versus entropy (s) is plotted. It is sometimes known as the h-s diagram and has an entirely different shape from the T-s diagrams. The chart contains a series of constant temperature lines, a series of constant pressure lines, a series of constant moisture or quality lines, and a series of constant superheat lines. The Mollier diagram is used only when quality is greater than 50% and for superheated steam.

Steam Tables
Steam tables consist of two sets of tables of the energy transfer properties of water and steam: saturated steam tables and superheated steam tables. Portions of the tables are shown in Figure 15. Both sets of tables are tabulations of pressure (P), temperature (T), specific volume (ν), specific enthalpy (h), and specific entropy (s). The following notation is used in steam tables. Some tables use v for ν (specific volume) because there is little possibility of confusing it with velocity.
T = temperature (°F)
P = pressure (psi)
ν = specific volume (ft3 /lbm)
νf = specific volume of saturated liquid (ft3 /lbm)
νg = specific volume of saturated vapor (ft3 /lbm)
νfg = specific volume change of vaporization (ft3 /lbm)
h = specific enthalpy (Btu/lbm)
hf = specific enthalpy of saturated liquid (Btu/lbm)
hg = specific enthalpy of saturated vapor (Btu/lbm)
hfg = specific enthalpy change of vaporization (Btu/lbm)
s = specific entropy (Btu/lbm-°R)
sf = specific entropy of saturated liquid (Btu/lbm-°R)
sg = specific entropy of saturated vapor (Btu/lbm-°R)
sfg = specific entropy change of vaporization (Btu/lbm-°R)
Sh = number of degrees of superheat (°F)
The saturated steam tables give the energy transfer properties of saturated water and saturated steam for temperatures from 32 to 705.47°F (the critical temperature) and for the corresponding pressure from 0.08849 to 3208.2 psi. Normally, the saturated steam tables are divided into two parts: temperature tables, which list the properties according to saturation temperature (Tsat); and pressure tables, which list them according to saturation pressure (Psat). Figure 15 shows a portion of a typical saturated steam temperature table and a portion of a typical saturated steam pressure table. The values of enthalpy and entropy given in these tables are measured relative to the properties of saturated liquid at 32°F. Hence, the enthalpy (hf ) of saturated liquid and the entropy (sf ) of saturated liquid have values of approximately zero at 32°F.

Most practical applications using the saturated steam tables involve steam-water mixtures. The key property of such mixtures is steam quality (x), defined as the mass of steam present per unit mass of steam-water mixture, or steam moisture content (y), defined as the mass of water present per unit mass of steam-water mixture. The following relationships exist between the quality of a liquid-vapor mixture and the specific volumes, enthalpies, or entropies of both phases and of the mixture itself. These relationships are used with the saturated steam tables.
ν – xνg +(1 – x)ν f
x – (ν – νf )/νfg
h – xhg + (1 – x)hf
x-(h-hf )/hfg
s – xsg + (1 – x)sf
x-(s – sf) / (sfg)
In order to solve problems in Thermodynamics, information concerning the “state” of the substance studied must be obtained. Usually, two properties (for example, v, p, T, h, s) of the substance must be known in order to determine the other needed properties. These other properties are usually obtained utilizing either the Mollier diagram (if the substance is steam) or the saturated and superheated steam tables, as shown in the Figures 14 and 15.The following two examples illustrate the use of the Mollier diagram and the steam tables.
Superheated steam at 700 psia and 680°F is expanded at constant entropy to 140 psia. What is the change in enthalpy?
Solution:
Use the Mollier Chart.
Locate point 1 at the intersection of the 700 psia and the 680°F line. Read h = 1333 Btu/lbm.
Follow the entropy line downward vertically to the 140 psia line and read h = 1178 Btu/lbm.
∆h = 1178 – 1333 = -155 Btu/lbm
Example 2: Use of steam tables
What are the specific volume, enthalpy, and entropy of steam having a quality of 90% at 400 psia?
Solution:
From the steam tables at 400 psia:
νf = 0.01934
νg = 1.14162
hf = 424.2
hfg = 780.4
sf = 0.6217
sfg = 0.8630
ν = νf + x(νfg)
ν = 0.01934 + (0.9)(1.14162) = 1.0468 lbm/ft3
h =hf + x(hfg)
h = 424.2 + (0.90)(780.4) = 1126.56 Btu/lbm
s =sf + x(sfg)
s = 0.6217 + (0.9)(0.8630) = 1.3984 Btu/lbm-°R
If the substance is not water vapor, the “state” of the substance is usually obtained through the use of T-s (temperature-entropy) and h-s (enthalpy-entropy) diagrams, available in most thermodynamics texts for common substances. The use of such diagrams is demonstrated by the following two examples.
Example 3: Use of the h-s diagramMercury is used in a nuclear facility. What is the enthalpy of the mercury if its pressure is 100 psia and its quality is 70%?
Solution:
From the mercury diagram, Figure 16, locate the pressure of 100 psia. Follow that line until reaching a quality of 70%. The intersection of the two lines gives an enthalpy that is equal to h = 115 Btu/lbm.

Example 4: Use of the T-s diagram
Carbon dioxide is used in a particular process in which the pressure is 100 psia and the temperature is 100°F. What is the enthalpy value of the gas?
Solution:
From the carbon dioxide diagram, Figure 17, locate the pressure of 100 psia. Follow that line until reaching a temperature of 100°F. The intersection of the two lines gives an enthalpy that is equal to h = 316 Btu/lbm.

Once the various states have been fixed for the particular process the substance has passed through (for example, going from a saturated liquid state to a compressed liquid state across a pump), energy exchanges may be determined as was shown in Example 1. The energy exchanges are never 100 percent efficient, as already discussed. The degree of efficiency obtained by the system depends upon the process through which the system has passed. Generally, the efficiency of a component depends upon how much friction exists in the flow of the substance, the pressure drops within the system, the inlet and outlet temperatures, and various other factors. The properties affecting the efficiency of the system are determined by use of the charts and diagrams mentioned in this section.
When power cycles are utilized for large systems, the efficiency of each component should be maximized in order to have the highest possible overall efficiency for the system. Each component affects the system efficiency in a different manner. To maximize efficiency, the practical approach to large systems is to have multistage expansion with reheat between stages and regenerators in the system where applicable.
Chapter 7: First Law of Thermodynamics
The First Law of Thermodynamics states:
Energy can neither be created nor destroyed, only altered in form.
For any system, energy transfer is associated with mass and energy crossing the control boundary, external work and/or heat crossing the boundary, and the change of stored energy within the control volume. The mass flow of fluid is associated with the kinetic, potential, internal, and “flow” energies that affect the overall energy balance of the system. The exchange of external work and/or heat complete the energy balance.
The First Law of Thermodynamics is referred to as the Conservation of Energy principle, meaning that energy can neither be created nor destroyed, but rather transformed into various forms as the fluid within the control volume is being studied. The energy balance spoken of here is maintained within the system being studied. The system is a region in space (control volume) through which the fluid passes. The various energies associated with the fluid are then observed as they cross the boundaries of the system and the balance is made.
As discussed in previous chapters of this module, a system may be one of three types: isolated, closed, or open. The open system, the most general of the three, indicates that mass, heat, and external work are allowed to cross the control boundary. The balance is expressed in words as: all energies into the system are equal to all energies leaving the system plus the change in storage of energies within the system. Recall that energy in thermodynamic systems is composed of kinetic energy (KE), potential energy (PE), internal energy (U), and flow energy (PL); as well as heat and work processes.
Σ (all energies in) = (all energies out) + Σ ∆(energy stored in system)
Σ Ein =Σ Eout + ∆E storage
For most industrial plant applications that most frequently use cycles, there is no change in storage (i.e. heat exchangers do not swell while in operation).
In equation form, the balance appears as indicated on Figure 14.
where:
Q = heat flow into the system (Btu/hr).
min = mass flow rate into the system (lbm/hr)
uin = specific internal energy into the system (Btu/lbm)
Pinνin = pressure-specific volume energy into the system (ft-lbf/lbm)
V2in / 2gc = kinetic energy into the system (ft-lbf /lbm) where
Vin = average velocity of fluid (ft/sec)
gc = the gravitational constant (32.17 ft-lbm/lbf-sec2 )
(g/gc) Zin = potential energy of the fluid entering the system (ft-lbf/lbm) where
Zin= height above reference level (ft)
g = acceleration due to gravity (ft/sec2 )
gc = the gravitational constant (32.17 ft-lbm/lbf-sec2 )
W = work flow out of the system (ft-lbf/hr)
mout = mass flow rate out of the system (lbm/hr)
uout = specific internal energy out of the system (Btu/lbm)
Poutνout = pressure-specific volume energy out of the system (ft-lbf/lbm)
V2out = kinetic energy out the system (ft-lbf/lbm)
(g/gc) Zout = potential energy out of the system (ft-lbf/lbm)

Heat and/or work can be directed into or out of the control volume. But, for convenience and as a standard convention, the net energy exchange is presented here with the net heat exchange assumed to be into the system and the net work assumed to be out of the system. If no mass crosses the boundary, but work and/or heat do, then the system is referred to as a “closed” system. If mass, work and heat do not cross the boundary (that is, the only energy exchanges taking place are within the system), then the system is referred to as an isolated system. Isolated and closed systems are nothing more than specialized cases of the open system. In this text, the open system approach to the First Law of Thermodynamics will be emphasized because it is more general. Also, almost all practical applications of the first law require an open system analysis.
An understanding of the control volume concept is essential in analyzing a thermodynamic problem or constructing an energy balance. Two basic approaches exist in studying Thermodynamics: the control mass approach and the control volume approach. The former is referred to as the LeGrange approach and the latter as the Eulerian approach. In the control mass concept, a “clump” of fluid is studied with its associated energies. The analyzer “rides” with the clump wherever it goes, keeping a balance of all energies affecting the clump.

The control volume approach is one in which a fixed region in space is established with specified control boundaries, as shown in Figure 15. The energies that cross the boundary of this control volume, including those with the mass crossing the boundary, are then studied and the balance performed. The control volume approach is usually used today in analyzing thermodynamic systems. It is more convenient and requires much less work in keeping track of the energy balances. Examples of control volume applications are included in Figures 16 to 18.


The forms of energy that may cross the control volume boundary include those associated with the mass (m) crossing the boundary. Mass in motion has potential (PE), kinetic (KE), and internal energy (U). In addition, since the flow is normally supplied with some driving power (a pump for example), there is another form of energy associated with the fluid caused by its pressure. This form of energy is referred to as flow energy (Pν-work). The thermodynamic terms thus representing the various forms of energy crossing the control boundary with the mass are given as m (u + Pν + ke + pe).
In open system analysis, the u and Pν terms occur so frequently that another property, enthalpy, has been defined as h=u+Pν. This results in the above expression being written as m (h + ke + pe). In addition to the mass and its energies, externally applied work (W), usually designated as shaft work, is another form of energy that may cross the system boundary.
In order to complete and satisfy the conservation of energy relationship, energy that is caused by neither mass nor shaft work is classified as heat energy (Q). Then we can describe the relationship in equation form as follows.
m(hin + pein + kein) + Q – m(hout + peout + keout) + W
where:
m = mass flow rate of working fluid (lbm/hr)
hin = specific enthalpy of the working fluid entering the system (Btu/lbm)
hout = specific enthalpy of the working fluid leaving the system (Btu/lbm)
pein = specific potential energy of working fluid entering the system (ft-lbf/lbm)
peout = specific potential energy of working fluid leaving the system (ft-lbf/lbm)
kein = specific kinetic energy of working fluid entering the system (ft-lbf/lbm)
keout = specific kinetic energy of working fluid leaving the system (ft-lbf/lbm)
W= rate of work done by the system (ft-lbf/hr)
Q = heat rate into the system (Btu/hr)
This example demonstrates that Figure 19 T-s Diagram with Rankine Cycles potential and kinetic energy terms are insignificant for a turbine, since the ∆pe and ∆ke values are less than 1 Btu/lbm.

When the system (the fluid being studied) changes its properties (temperature, pressure, volume) from one value to another as a consequence of work or heat or internal energy exchange, then it is said that the fluid has gone through a “process.” In some processes, the relationships between pressure, temperature, and volume are specified as the fluid goes from one thermodynamic state to another. The most common processes are those in which the temperature, pressure, or volume is held constant during the process. These would be classified as isothermal, isobaric, or isovolumetric processes, respectively. Iso means “constant or one.” If the fluid passes through various processes and then eventually returns to the same state it began with, the system is said to have undergone a cyclic process. One such cyclic process used is the Rankine cycle, two examples of which are shown in Figure 19.
The processes that comprise the cycle are described below.
ab: Liquid is compressed with no change in entropy (by ideal pump).
bc: Constant pressure transfer of heat in the boiler. Heat is added to the compressed liquid, two-phase, and superheat states.
cd: Constant entropy expansion with shaft work output (in ideal turbine).
da: Constant pressure transfer of heat in the sink. Unavailable heat is rejected to the heat sink (condenser).
Note the individual processes the fluid must go through before completing the complete cycle. Rankine cycles will be discussed in greater detail later in this module. Figure 20 shows a typical steam plant cycle. Heat is supplied to the steam generator (boiler) where liquid is converted to steam or vapor. The vapor is then expanded adiabatically in the turbine to produce a work output. Vapor leaving the turbine then enters the condenser where heat is removed and the vapor is condensed into the liquid state. The condensation process is the heat-rejection mechanism for the cycle. Saturated liquid is delivered to the condensate pump and then the feed pump where its pressure is raised to the saturation pressure corresponding to the steam generator temperature, and the high pressure liquid is delivered to the steam generator where the cycle repeats itself.

With the example complete, it seems appropriate to discuss the various components of a typical steam plant system. Although such a system is extremely complex, only the major components will be discussed. A typical steam plant system consists of: a heat source to produce the thermal energy (e.g. nuclear or fossil fuel); a steam generator to change the thermal energy into steam energy (a complete steam plant usually exists in connection with the steam generator in converting the steam into eventual electrical energy); pumps to transfer the fluid back to the heat source (reactor coolant pumps in a nuclear reactor); a pressurizer to ensure that the primary system maintains its desired pressure; and the necessary piping to ensure the fluid passes through each stage of its cyclic process. Of necessity, the steam plant is a large “closed” system. However, each component of the system is thermodynamically analyzed as an open system as the fluid passes through it. Of primary importance is the process of dissipating the energy created by the heat source. This process takes place in the steam generator, which acts as a giant two-phase heat generator.
The hot fluid from the heat source passes through the primary side of the steam generator where its energy is passed to the secondary side of the heat exchanger in such a manner as to create steam. The fluid, with its energy removed from the primary side, leaves the steam generator at a lower temperature, and is pumped back to the heat source to be “re-heated.” Each major component of a steam plant can be treated as a separate open system problem. A thermodynamic analysis, using the various forms of energies discussed, can be applied to the particular component in studying its behavior. A simplified example of the thermodynamics involved in the steam generator is shown below.
The minus sign indicating heat out of the heat exchanger, which is consistent with the physical case. This example demonstrates that for a heat exchanger, the heat transfer rate can be calculated using the equation (hout-hin), or It is important Q˙ m˙ Q˙ mc˙ p ∆T. to note that the later equation can only be used when no phase change occurs since ∆T = 0 during a phase change. The first equation can be used for a phase change heat transfer process as well as for latent heat calculations.
The pumps used for returning the fluid to the heat source can be analyzed as a thermodynamic system also. One such example is illustrated in Example 3.
Note: The minus sign indicating work put into the fluid by the pump. 1 hp = 2545 Btu/hr.
A thermodynamic balance across the reactor core gives an indication of the amount of heat removed by the coolant that is given off by the fuel rods.
For this example Q-mcp∆T has been used to calculate the heat transfer rate since no phase change has occurred. However, Q-m(hout-hin) could also have been used had the problem data included inlet and outlet enthalpies.
The individual principal components of a reactor system have been thermodynamically analyzed. If all components were combined into an overall system, the system could be analyzed as a “closed” system problem. Such an analysis is illustrated in the following example.
Of the examples just completed, emphasis should be placed on the heat exchanger analysis. Both the primary side and the secondary side have their own energy balances as the heat energy is transferred from one fluid to the other. In calculating heat exchanger heat transfer rates, we found that we could use the equations Q-mcp∆h.
Perhaps a short analysis of the secondary side of the heat exchanger will aid in understanding the heat exchanger’s importance in the energy conversion process.
Steam flows through a condenser at 2.0 x 10⁶ kg/hr, entering as saturated vapor at 40°C (h = 2574 kj/kg), and leaving at the same pressure as subcooled liquid at 30°C (h = 125.8 kJ/kg). Cooling water is available at 18°C (h = 75.6 kJ/kg). Environmental requirements limit the exit temperature to 25°C (h = 104.9 kJ/kg). Determine the required cooling water flow rate.
Solution:
Thermal balance gives the following:
Qstm = -Qew
mstm(hout – hin)stm = mcw(hout – hin)cw
mcw = mstm(hout – hin)stm/(hout – hin)cw
=w.0x106kg/hr(125.8-2574 kj/kg/(104.9-75.6kj/kg)
mcw = 1.67×10⁸ kg/hr
In this example, we calculated the flow rate using the equation since a phase change Q = m∆h occurred when the steam was condensed to liquid water. would not have worked Q˙ mc˙ p ∆T since ∆T=0 for a phase change. Had we attempted to solve the problem using , we Q= mcp ∆T would have discovered that an error occurs since the ∆T = 10o C is the ∆T needed to subcool the liquid from saturation at 40o C to a subcooled value of 30o C. Therefore, the heat transfer process to condense the steam to a saturated liquid has not been taken into account.
Chapter 8: Second Law of Thermodynamics
Second Law of Thermodynamics
One of the earliest statements of the Second Law of Thermodynamics was made by R. Clausius in 1850. He stated the following.
It is impossible to construct a device that operates in a cycle and produces no effect other than the removal of heat from a body at one temperature and the absorption of an equal quantity of heat by a body at a higher temperature.
With the Second Law of Thermodynamics, the limitations imposed on any process can be studied to determine the maximum possible efficiencies of such a process and then a comparison can be made between the maximum possible efficiency and the actual efficiency achieved. One of the areas of application of the second law is the study of energy-conversion systems. For example, it is not possible to convert all the energy obtained from a nuclear reactor into electrical energy. There must be losses in the conversion process. The second law can be used to derive an expression for the maximum possible energy conversion efficiency taking those losses into account. Therefore, the second law denies the possibility of completely converting into work all of the heat supplied to a system operating in a cycle, no matter how perfectly designed the system may be. The concept of the second law is best stated using Max Planck’s description:
It is impossible to construct an engine that will work in a complete cycle and produce no other effect except the raising of a weight and the cooling of a heat reservoir.
The Second Law of Thermodynamics is needed because the First Law of Thermodynamics does not define the energy conversion process completely. The first law is used to relate and to evaluate the various energies involved in a process. However, no information about the direction of the process can be obtained by the application of the first law. Early in the development of the science of thermodynamics, investigators noted that while work could be converted completely into heat, the converse was never true for a cyclic process. Certain natural processes were also observed always to proceed in a certain direction (e.g., heat transfer occurs from a hot to a cold body). The second law was developed as an explanation of these natural phenomena.
Entropy
One consequence of the second law is the development of the physical property of matter termed entropy (S). Entropy was introduced to help explain the Second Law of Thermodynamics. The change in this property is used to determine the direction in which a given process will proceed. Entropy can also be explained as a measure of the unavailability of heat to perform work in a cycle. This relates to the second law since the second law predicts that not all heat provided to a cycle can be transformed into an equal amount of work, some heat rejection must take place. The change in entropy is defined as the ratio of heat transferred during a reversible process to the absolute temperature of the system.
∆S = ∆Q / Tabs (For a reversible process)
where:
∆S = the change in entropy of a system during some process (Btu/°R)
∆Q = the amount of heat added to the system during the process (Btu)
Tabs = the absolute temperature at which the heat was transferred (°R)
The second law can also be expressed as ∆S≥O for a closed cycle. In other words, entropy must increase or stay the same for a cyclic system; it can never decrease.Entropy is a property of a system. It is an extensive property that, like the total internal energy or total enthalpy, may be calculated from specific entropies based on a unit mass quantity of the system, so that S = ms. For pure substances, values of the specific entropy may be tabulated along with specific enthalpy, specific volume, and other thermodynamic properties of interest. One place to find this tabulated information is in the steam tables described in a previous chapter (refer back to Figure 19, also listed below).
Specific entropy, because it is a property, is advantageously used as one of the coordinates when representing a reversible process graphically. The area under a reversible process curve on the T-s diagram represents the quantity of heat transferred during the process.
Thermodynamic problems, processes, and cycles are often investigated by substitution of reversible processes for the actual irreversible process to aid the student in a second law analysis. This substitution is especially helpful because only reversible processes can be depicted on the diagrams (h-s and T-s, for example) used for the analysis. Actual or irreversible processes cannot be drawn since they are not a succession of equilibrium conditions. Only the initial and final conditions of irreversible processes are known; however, some thermodynamics texts represent an irreversible process by dotted lines on the diagrams.
Carnot’s Principle
With the practice of using reversible processes, Sadi Carnot in 1824 advanced the study of the second law by disclosing a principle consisting of the following propositions.
1. No engine can be more efficient than a reversible engine operating between the same high temperature and low temperature reservoirs. Here the term heat reservoir is taken to mean either a heat source or a heat sink.
2. The efficiencies of all reversible engines operating between the same constant temperature reservoirs are the same.
3. The efficiency of a reversible engine depends only upon the temperatures of the heat source and heat receiver.
Carnot Cycle
The above principle is best demonstrated with a simple cycle (shown in Figure 21) and an example of a proposed heat power cycle. The cycle consists of the following reversible processes.
1-2: adiabatic compression from TC to TH due to work performed on fluid.
2-3: isothermal expansion as fluid expands when heat is added to the fluid at temperature TH.
3-4: adiabatic expansion as the fluid performs work during the expansion process and temperature drops from TH to TC.
4-1: isothermal compression as the fluid contracts when heat is removed from the fluid at temperature TC.
This cycle is known as a Carnot Cycle. The heat input (QH) in a Carnot Cycle is graphically represented on Figure 21 as the area under line 2-3. The heat rejected (QC) is graphically represented as the area under line 1-4. The difference between the heat added and the heat rejected is the net work (sum of all work processes), which is represented as the area of rectangle 1-2-3-4.

The efficiency (η) of the cycle is the ratio of the net work of the cycle to the heat input to the cycle. This ratio can be expressed by the following equation.
η = (QH – QC)/QH = (TH – TC)/TH
= 1 – (TC/TH) (1-23)
where:
η = cycle efficiency
TC = designates the low-temperature reservoir (°R)
TH = designates the high-temperature reservoir (°R)
Equation 1-23 shows that the maximum possible efficiency exists when TH is at its largest possible value or when TC is at its smallest value. Since all practical systems and processes are really irreversible, the above efficiency represents an upper limit of efficiency for any given system operating between the same two temperatures. The system’s maximum possible efficiency would be that of a Carnot efficiency, but because Carnot efficiencies represent reversible processes, the actual system will not reach this efficiency value. Thus, the Carnot efficiency serves as an unattainable upper limit for any real system’s efficiency. The following example demonstrates the above principles.
The most important aspect of the second law for our practical purposes is the determination of maximum possible efficiencies obtained from a power system. Actual efficiencies will always be less than this maximum. The losses (friction, for example) in the system and the fact that systems are not truly reversible preclude us from obtaining the maximum possible efficiency. An illustration of the difference that may exist between the ideal and actual efficiency is presented in Figure 22 and the following example.

An open system analysis was performed using the First Law of Thermodynamics in the previous chapter. The second law problems are treated in much the same manner; that is, an isolated, closed, or open system is used in the analysis depending upon the types of energy that cross the boundary. As with the first law, the open system analysis using the second law equations is the more general case, with the closed and isolated systems being “special” cases of the open system. The solution to second law problems is very similar to the approach used in the first law analysis.
Figure 23 illustrates the control volume from the viewpoint of the second law. In this diagram, the fluid moves through the control volume from section in to section out while work is delivered external to the control volume. We assume that the boundary of the control volume is at some environmental temperature and that all of the heat transfer (Q) occurs at this boundary. We have already noted that entropy is a property, so it may be transported with the flow of the fluid into and out of the control volume, just like enthalpy or internal energy. The entropy flow into the control volume resulting from mass transport is, therefore, minsin, and the entropy flow out of the control volume is moutsout, assuming that the properties are uniform at sections in and out. Entropy may also be added to the control volume because of heat transfer at the boundary of the control volume.

A simple demonstration of the use of this form of system in second law analysis will give the student a better understanding of its use.
It should always be kept in mind that the Second Law of Thermodynamics gives an upper limit (which is never reached in physical systems) to how efficiently a thermodynamic system can perform. A determination of that efficiency is as simple as knowing the inlet and exit temperatures of the overall system (one that works in a cycle) and applying Carnot’s efficiency equation using these temperatures in absolute degrees.
Diagrams of Ideal and Real Processes
Any ideal thermodynamic process can be drawn as a path on a property diagram, such as a T-s or an h-s diagram. A real process that approximates the ideal process can also be represented on the same diagrams (usually with the use of dashed lines).
In an ideal process involving either a reversible expansion or a reversible compression, the entropy will be constant. These isentropic processes will be represented by vertical lines on either T-s or h-s diagrams, since entropy is on the horizontal axis and its value does not change. A real expansion or compression process operating between the same pressures as the ideal process will look much the same, but the dashed lines representing the real process will slant slightly towards the right since the entropy will increase from the start to the end of the process. Figures 24 and 25 show ideal and real expansion and compression processes on T-s and h-s diagrams.


Power Plant Components
Figure 24 Expansion and Compression Processes on T-s Diagram Figure 25 Expansion and Compression Processes on h-s Diagram In order to analyze a complete power plant steam power cycle, it is first necessary to analyze the elements which make up such cycles. (See Figure 26) Although specific designs differ, there are three basic types of elements in power cycles, (1) turbines, (2) pumps and (3) heat exchangers. Associated with each of these three types of elements is a characteristic change in the properties of the working fluid.

Previously we have calculated Figure 26 Steam Cycle system efficiency by knowing the temperature of the heat source and the heat sink. It is also possible to calculate the efficiencies of each individual component.
The efficiency of each type of component can be calculated by comparing the actual work produced by the component to the work that would have been produced by an ideal component operating isentropically between the same inlet and outlet conditions.
A steam turbine is designed to extract energy from the working fluid (steam) and use it to do work in the form of rotating the turbine shaft. The working fluid does work as it expands through the turbine. The shaft work is then converted to electrical energy by the generator. In the application of the first law, general energy equation to a simple turbine under steady flow conditions, it is found that the decrease in the enthalpy of the working fluid Hin – Hout equals the work done by the working fluid in the turbine (Wt ).
Hin – Hout = Wt (1-24)
m (hin – hout) = wt (1-25)
where:
Hin = enthalpy of the working fluid entering the turbine (Btu)
Hout = enthalpy of the working fluid leaving the turbine (Btu)
Wt = work done by the turbine (ft-lbf )
m = mass flow rate of the working fluid (lbm/hr)
hin = specific enthalpy of the working fluid entering the turbine (Btu/lbm)
hout = specific enthalpy of the working fluid leaving the turbine (Btu/lbm)
wt = power of turbine (Btu/hr)
These relationships apply when the kinetic and potential energy changes and the heat losses of the working fluid while in the turbine are negligible. For most practical applications, these are valid assumptions. However, to apply these relationships, one additional definition is necessary. The steady flow performance of a turbine is idealized by assuming that in an ideal case the working fluid does work reversibly by expanding at a constant entropy. This defines the so-called ideal turbine. In an ideal turbine, the entropy of the working fluid entering the turbine Sin equals the entropy of the working fluid leaving the turbine.
Sin = Sout
sin = sout
where:
Sin = entropy of the working fluid entering the turbine (Btu/o R)
Sout = entropy of the working fluid leaving the turbine (Btu/o R)
sin = specific entropy of the working fluid entering the turbine (Btu/lbm -o R)
sout = specific entropy of the working fluid leaving the turbine (Btu/lbm -o R)
The reason for defining an ideal turbine is to provide a basis for analyzing the performance of turbines. An ideal turbine performs the maximum amount of work theoretically possible.
An actual turbine does less work because of friction losses in the blades, leakage past the blades and, to a lesser extent, mechanical friction. Turbine efficiency , sometimes called isentropic η t turbine efficiency because an ideal turbine is defined as one which operates at constant entropy, is defined as the ratio of the actual work done by the turbine Wt, actual to the work that would be done by the turbine if it were an ideal turbine Wt,ideal.
ηt = Wt,actual / Wt,ideal (1-26)
η = (hin – hout) actual / (hin – hout)ideal (1-27)
where:
ηt = turbine efficiency (no units)
Wt,actual = actual work done by the turbine (ft-lbf)
Wt,ideal = work done by an ideal turbine (ft-lbf)
(hin – hout)actual = actual enthalpy change of the working fluid (Btu/lbm)
(hin – hout)ideal = actual enthalpy change of the working fluid in an ideal turbine (Btu/lbm)
In many cases, the turbine Figure 27 Comparison of Ideal and Actual Turbine Performances efficiency has been determined η t independently. This permits the actual work done to be calculated directly by multiplying the turbine efficiency by the work done by η t an ideal turbine under the same conditions. For small turbines, the turbine efficiency is generally 60% to 80%; for large turbines, it is generally about 90%.

The actual and idealized performances of a turbine may be compared conveniently using a T-s diagram. Figure 27 shows such a comparison. The ideal case is a constant entropy. It is represented by a vertical line on the T-s diagram. The actual turbine involves an increase in entropy. The smaller the increase in entropy, the closer the turbine efficiency is to 1.0 or 100%.
A pump is designed to move the working fluid by doing work on it. In the application of the first law general energy equation to a simple pump under steady flow conditions, it is found that the increase in the enthalpy of the working fluid Hout – Hin equals the work done by the pump, Wp, on the working fluid.
Hout – Hin = Wp (1-28)
m (hout – hin) = wp (1-29)
where:
Hout = enthalpy of the working fluid leaving the pump (Btu)
Hin = enthalpy of the working fluid entering the pump (Btu)
Wp = work done by the pump on the working fluid (ft-lbf)
m = mass flow rate of the working fluid (lbm/hr)
hout = specific enthalpy of the working fluid leaving the pump (Btu/lbm)
hin = specific enthalpy of the working fluid entering the pump (Btu/lbm)
wp = power of pump (Btu/hr)
These relationships apply when the kinetic and potential energy changes and the heat losses of the working fluid while in the pump are negligible. For most practical applications, these are valid assumptions. It is also assumed that the working fluid is incompressible. For the ideal case, it can be shown that the work done by the pump Wp is equal to the change in enthalpy across the ideal pump.
Wp ideal = (Hout – Hin)ideal (1-30)
wp ideal = (hout – hin)ideal (1-31)
where:
Wp = work done by the pump on the working fluid (ft-lbf)
Hout = enthalpy of the working fluid leaving the pump (Btu)
Hin = enthalpy of the working fluid entering the pump (Btu)
w = power of pump (Btu/hr) p
m = mass flow rate of the working fluid (lbm/hr)
hout = specific enthalpy of the working fluid leaving the pump (Btu/lbm)
hin = specific enthalpy of the working fluid entering the pump (Btu/lbm)
The reason for defining an ideal pump is to provide a basis for analyzing the performance of actual pumps. A pump requires more work because of unavoidable losses due to friction and fluid turbulence. The work done by a pump Wp is equal to the change in enthalpy across the actual pump.
Wp actual = (Hout – Hin)actual (1-32)
wp actual = m (hout – hin)actual (1-33)
Pump efficiency,η p, is defined as the ratio of the work required by the pump if it were an ideal η p pump wp, ideal to the actual work required by the pump wp, actual.
ηp = Wp, ideal / Wp, actual (1-34)
Pump efficiency, η p , relates the work required by an ideal pump to the actual work required by the pump; it relates the minimum amount of work theoretically possible to the actual work required by the pump. However, the work required by a pump is normally only an intermediate form of energy. Normally a motor or turbine is used to run the pump. Pump efficiency does not account for losses in this motor or turbine. An additional efficiency factor, motor efficiency η m , is defined as the ratio of the actual work required by the pump to the electrical energy input m to the pump motor, when both are expressed in the same units.
ηm = Wp, actual / Wm, in C
where:
ηm = motor efficiency (no units)
Wp, actual = actual work required by the pump (ft-lbf)
Wm, in = electrical energy input to the pump motor (kw-hr)
C = conversion factor = 2.655 x 106 ft-lbf/kw-hr
Like pump efficiency ηp , motor efficiency ηm is always less than 1.0 or 100% for an actual pump motor. The combination of pump efficiency ηp and motor efficiency ηm relates the ideal pump to the electrical energy input to the pump motor.
ηm ηp = Wp, ideal / Wm, in C (1-35)
where:
ηm = motor efficiency (no units)
ηp = pump efficiency (no units)
Wp, ideal = ideal work required by the pump (ft-lbf)
Wm, in = electrical energy input to the pump motor (kw-hr)
C = conversion factor = 2.655 x 106 ft-lbf/kw-hr
A heat exchanger is designed to transfer heat between two working fluids. There are several heat exchangers used in power plant steam cycles. In the steam generator or boiler, the heat source (e.g., reactor coolant) is used to heat and vaporize the feedwater. In the condenser, the steam exhausting from the turbine is condensed before being returned to the steam generator. In addition to these two major heat exchangers, numerous smaller heat exchangers are used throughout the steam cycle. Two primary factors determine the rate of heat transfer and the temperature difference between the two fluids passing through the heat exchanger.
In the application of the first law general energy equation to a simple heat exchanger under steady flow conditions, it is found that the mass flow rates and enthalpies of the two fluids are related by the following relationship.
m1 (hout,1 – hin,1) = -m2 (hout,2 – hin,2) (1-36)
where:
m = mass flow rate of the working fluid 1 (lbm/hr) 1
m = mass flow rate of the working fluid 2 (lbm/hr) 2
hout, 1 = specific enthalpy of the working fluid 1 leaving the heat exchanger (Btu/lbm)
hin, 1 = specific enthalpy of the working fluid 1 entering the heat exchanger (Btu/lbm)
hout, 2 = specific enthalpy of the working fluid 2 leaving the heat exchanger (Btu/lbm)
hin, 2 = specific enthalpy of the working fluid 2 entering the heat exchanger (Btu/lbm)
In the preceding sections we have discussed the Carnot cycle, cycle efficiencies, and component efficiencies. In this section we will apply this information to allow us to compare and evaluate various ideal and real cycles. This will allow us to determine how modifying a cycle will affect the cycle’s available energy that can be extracted for work.
Since the efficiency of a Carnot cycle is solely dependent on the temperature of the heat source and the temperature of the heat sink, it follows that to improve a cycles’ efficiency all we have to do is increase the temperature of the heat source and decrease the temperature of the heat sink. In the real world the ability to do this is limited by the following constraints.
1. For a real cycle the heat sink is limited by the fact that the “earth” is our final heat sink. And therefore, is fixed at about 60°F (520°R).
2. The heat source is limited to the combustion temperatures of the fuel to be burned or the maximum limits placed on nuclear fuels by their structural components (pellets, cladding etc.). In the case of fossil fuel cycles the upper limit is ~3040°F (3500°R). But even this temperature is not attainable due to the metallurgical restraints of the boilers, and therefore they are limited to about 1500°F (1960°R) for a maximum heat source temperature.
Using these limits to calculate the maximum efficiency attainable by an ideal Carnot cycle gives the following.
η = TSOURCE – TSINK / TSOURCE = 1960o R – 520o R / 1960o R = 73.5%
This calculation indicates that the Carnot cycle, operating with ideal components under real world constraints, should convert almost 3/4 of the input heat into work. But, as will be shown, this ideal efficiency is well beyond the present capabilities of any real systems.
Heat Rejection
To understand why an efficiency of 73% is not possible we must analyze the Carnot cycle, then compare the cycle using real and ideal components. We will do this by looking at the T-s diagrams of Carnot cycles using both real and ideal components.
The energy added to a working fluid during the Carnot isothermal expansion is given by qs. Not all of this energy is available for use by the heat engine since a portion of it (q r ) must be rejected to the environment. This is given by:
qr = To ∆s in units of Btu/lbm (1-37)
where To is the average heat sink temperature of 520°R. The available energy (A.E.) for the Carnot cycle may be given as:
A.E. = qs – qr (1-38)
Substituting equation 1-37 for qr gives:
A.E. = qs – To ∆s in units of Btu/lbm. (1-39)

and is equal to the area of the shaded Figure 28 Carnot Cycle region labeled available energy in Figure 28 between the temperatures 1962° and 520°R. From Figure 28 it can been seen that any cycle operating at a temperature of less than 1962°R will be less efficient. Note that by developing materials capable of withstanding the stresses above 1962°R, we could greatly add to the energy available for use by the plant cycle. From equation 1-37, one can see why the change in entropy can be defined as a measure of the energy unavailable to do work. If the temperature of the heat sink is known, then the change in entropy does correspond to a measure of the heat rejected by the engine.
Figure 29 is a typical power cycle employed by a fossil fuel plant. The working fluid is water, which places certain restrictions on the cycle. If we wish to limit ourselves to operation at or below 2000 psia, it is readily apparent that constant heat addition at our maximum temperature of 1962°R is not possible (Figure 29, 2’ to 4). In reality, the nature of water and certain elements of the process controls require us to add heat in a constant pressure process instead (Figure 29, 1-2-3-4). Because of this, the average temperature at which we are adding heat is far below the maximum allowable material temperature.

As can be seen, the actual available energy (area under the 1-2-3-4 curve, Figure 29) is less than half of what is available from the ideal Carnot cycle (area under 1-2’-4 curve, Figure 29) operating between the same two temperatures. Typical thermal efficiencies for fossil plants are on the order of 40% while nuclear plants have efficiencies of the order of 31%. Note that these numbers are less than 1/2 of the maximum thermal efficiency of the ideal Carnot cycle calculated earlier.
Figure 30 shows a proposed Carnot steam cycle superimposed on a T-s diagram. As shown, it has several problems which make it undesirable as a practical power cycle. First a great deal of pump work is required to compress a two phase mixture of water and steam from point 1 to the saturated liquid state at point 2. Second, this same isentropic compression will probably result in some pump cavitation in the feed system. Finally, a condenser designed to produce a twophase mixture at the outlet (point 1) would pose technical problems.

Early thermodynamic developments were centered around improving the performance of contemporary steam engines. It was desirable to construct a cycle that was as close to being reversible as possible and would better lend itself to the characteristics of steam and process control than the Carnot cycle did. Towards this end, the Rankine cycle was developed.
The main feature of the Rankine cycle, shown in Figure 31, is that it confines the isentropic compression process to the liquid phase only (Figure 31 points 1 to 2). This minimizes the amount of work required to attain operating pressures and avoids the mechanical problems associated with pumping a two-phase mixture. The compression process shown in figure 31 between points 1 and 2 is greatly exaggerated* . In reality, a temperature rise of only 1°F occurs in compressing water from 14.7 psig at a saturation temperature of 212°F to 1000 psig.

* The constant pressure lines converge rapidly in the subcooled or compressed liquid region and it is difficult to distinguish them from the saturated liquid line without artificially expanding them away from it.
In a Rankine cycle available and unavailable energy on a T-s diagram, like a T-s diagram of a Carnot cycle, is represented by the areas under the curves. The larger the unavailable energy, the less efficient the cycle.

From the T-s diagram (Figure 32) it can also be seen that if an ideal component, in this case the turbine, is replaced with a non-ideal component, the efficiency of the cycle will be reduced. This is due to the fact that the non-ideal turbine incurs an increase in entropy which increases the area under the T-s curve for the cycle. But the increase in the area of available energy (3-2-3’, Figure 32) is less than the increase in area for unavailable energy (a-3-3’-b, Figure 32).

The same loss of cycle efficiency can be seen when two Rankine cycles are compared (see Figure 33). Using this type of comparison, the amount of rejected energy to available energy of one cycle can be compared to another cycle to determine which cycle is the most efficient, i.e. has the least amount of unavailable energy.
An h-s diagram can also be Figure 34 h-s Diagram used to compare systems and help determine their efficiencies. Like the T-s diagram, the h-s diagram will show (Figure 34) that substituting non-ideal components in place of ideal components in a cycle, will result in the reduction in the cycles efficiency. This is because a change in enthalpy (h) always occurs when work is done or heat is added or removed in an actual cycle (non-ideal). This deviation from an ideal constant enthalpy (vertical line on the diagram) allows the inefficiencies of the cycle to be easily seen on a h-s diagram.

Typical Steam Cycle
Figure 35 shows a simplified version of the major components of a typical steam plant cycle. This is a simplified version and does not contain the exact detail that may be found at most power plants. However, for the purpose of understanding the basic operation of a power cycle, further detail is not necessary.
The following are the processes that comprise the cycle:
1-2: Saturated steam from the steam generator is expanded in the high pressure (HP) turbine to provide shaft work output at a constant entropy.
2-3: The moist steam from the exit of the HP turbine is dried and superheated in the moisture separator reheater (MSR).
3-4: Superheated steam from the MSR is expanded in the low pressure (LP) turbine to provide shaft work output at a constant entropy.
4-5: Steam exhaust from the turbine is condensed in the condenser in which heat is transferred to the cooling water under a constant vacuum condition.
5-6: The feedwater is compressed as a liquid by the condensate and feedwater pump and the feedwater is preheated by the feedwater heaters.
6-1: Heat is added to the working fluid in the steam generator under a constant pressure condition.

The previous cycle can also be represented on a T-s diagram as was done with the ideal Carnot and Rankine cycles. This is shown in Figure 36. The numbered points on the cycle correspond to the numbered points on Figure 36.
It must be pointed out that the cycle we have just shown is an ideal cycle and does not exactly represent the actual processes in the plant. The turbine and pumps in an ideal cycle are ideal pumps and turbines and therefore do not exhibit an increase in entropy across them. Real pumps and turbines would exhibit an entropy increase across them.
Figure 37 is a T-s diagram of a cycle which more closely approximates actual plant processes. The pumps and turbines in this cycle more closely approximate real pumps and turbines and thus exhibit an entropy increase across them. Additionally, in this cycle, a small degree of subcooling is evident in the condenser as shown by the small dip down to point 5. This small amount of subcooling will decrease cycle efficiency since additional heat has been removed from the cycle to the cooling water as heat rejected. This additional heat rejected must then be made up for in the steam generator. Therefore, it can be seen that excessive condenser subcooling will decrease cycle efficiency. By controlling the temperature or flow rate of the cooling water to the condenser, the operator can directly effect the overall cycle efficiency.

It is sometimes useful to plot on the Mollier diagram the processes that occur during the cycle. This is done on Figure 38. The numbered points on Figure 38 correspond to the numbered points on Figures 35 and 36. Because the Mollier diagram is a plot of the conditions existing for water in vapor form, the portions of the plot which fall into the region of liquid water do not show up on the Mollier diagram. The following conditions were used in plotting the curves on Figure 38.
Point 1: Saturated steam at 540o F
Point 2: 82.5% quality at exit of HP turbine
Point 3: Temperature of superheated steam is 440o F
Point 4: Condenser vacuum is 1 psia
The solid lines on Figure 38 represent the conditions for a cycle which uses ideal turbines as verified by the fact that no entropy change is shown across the turbines. The dotted lines on Figure 38 represent the path taken if real turbines were considered, in which case an increase in entropy is evident.
Causes of Inefficiency
In the preceding sections, cycle and component efficiencies have been discussed, but the actual causes or reasons for the inefficiencies have not been explained. In this section we will compare some of the types and causes for the inefficiencies of real components and cycles to that of their “ideal” counterparts.
Components
In real systems, a percentage of the overall cycle inefficiency is due to the losses by the individual components. Turbines, pumps, and compressors all behave non-ideally due to heat losses, friction and windage losses. All of these losses contribute to the non-isentropic behavior of real equipment. As explained previously (Figures 24, 25) these losses can be seen as an increase in the system’s entropy or amount of energy that is unavailable for use by the cycle.
Cycles
In real systems, a second source of inefficiencies is from the compromises made due to cost and other factors in the design and operation of the cycle. Examples of these types of losses are: In a large power generating station the condensers are designed to subcool the liquid by 8-10°F. This subcooling allows the condensate pumps to pump the water forward without cavitation. But, each degree of subcooling is energy that must be put back by reheating the water, and this heat (energy) does no useful work and therefore increases the inefficiency of the cycle. Another example of a loss due to a system’s design is heat loss to the environment, i.e. thin or poor insulation. Again this is energy lost to the system and therefore unavailable to do work. Friction is another real world loss, both resistance to fluid flow and mechanical friction in machines. All of these contribute to the system’s inefficiency.
Chapter 9: Compression Processes
Boyle’s and Charles’ Laws
The results of certain experiments with gases at relatively low pressure led Robert Boyle to formulate a well-known law. It states that:
the pressure of a gas expanding at constant temperature varies inversely to the volume, or
(P1)(V1) = (P2)(V2) = (P3)(V3) = constant. (1-40)
Charles, also as the result of experimentation, concluded that:
the pressure of a gas varies directly with temperature when the volume is held constant, and the volume varies directly with temperature when the pressure is held constant, or
V1/V2= T1/T2 or P1/P2=T1/T2 (1-41)
Ideal Gas Law
By combining the results of Charles’ and Boyle’s experiments, the relationship
Pv/T = constant (1-42)
may be obtained. The constant in the above equation is called the ideal gas constant and is designated by R; thus the ideal gas equation becomes
Pν = RT (1-43)
where the pressure and temperature are absolute values. The values of the ideal gas constant (R) for several of the more common gases are given in Figure 39.
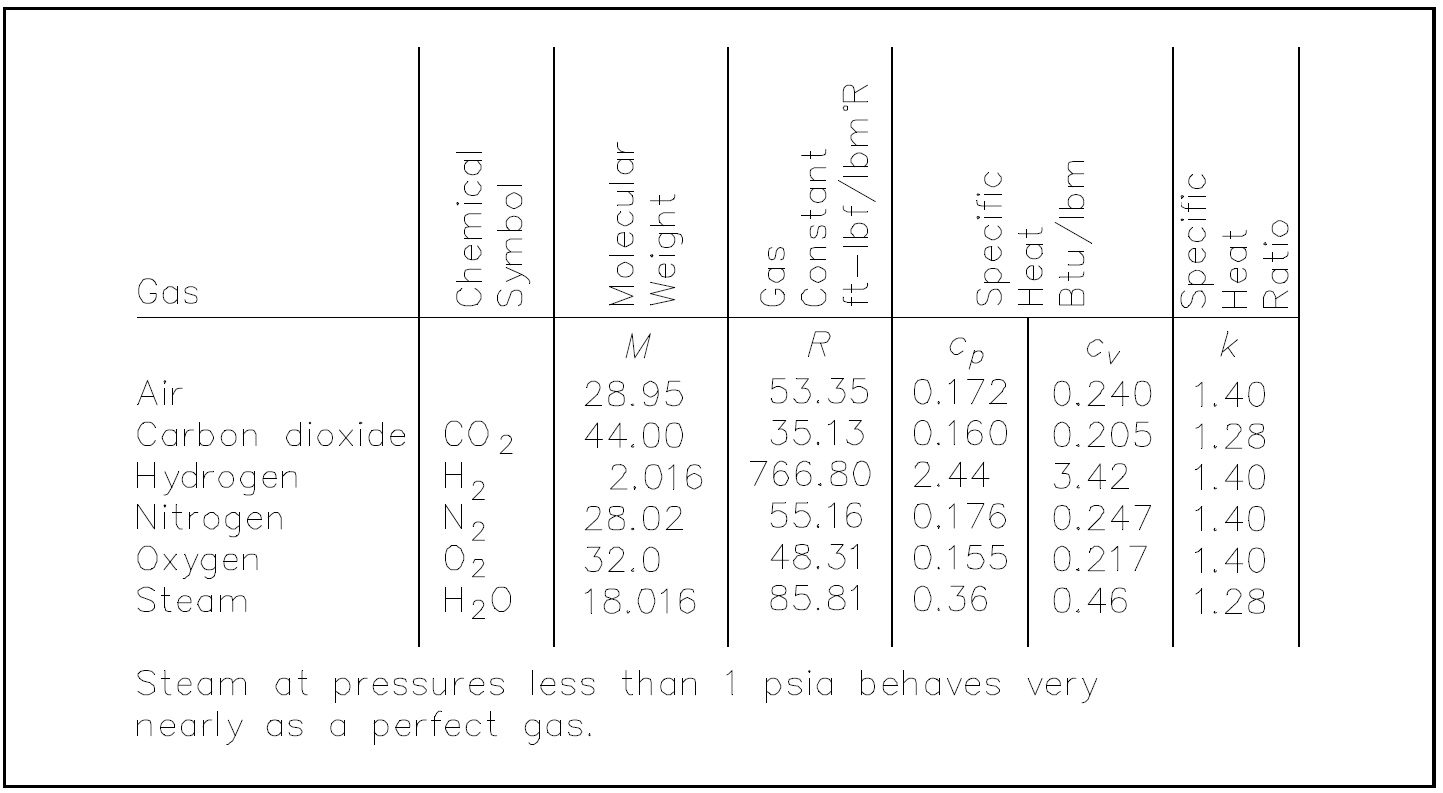
The individual gas constant (R) may be obtained by dividing the universal gas constant (Ro) by the molecular weight (MW) of the gas, . The units of R must always be consistent R=Ro/MW with the units of pressure, temperature, and volume used in the gas equation. No real gases follow the ideal gas law or equation completely. At temperatures near a gases boiling point, increases in pressure will cause condensation to take place and drastic decreases in volume. At very high pressures, the intermolecular forces of a gas are significant. However, most gases are in approximate agreement at pressures and temperatures above their boiling point.
The ideal gas law is utilized by engineers working with gases because it is simple to use and approximates real gas behavior. Most physical conditions of gases used by man fit the above description. Perhaps the most common use of gas behavior studied by engineers is that of the compression process using ideal gas approximations. Such a compression process may occur at constant temperature (pV = constant), constant volume, or adiabatic (no heat transfer). Whatever the process, the amount of work that results from it depends upon the process, as brought out in the discussion on the First Law of Thermodynamics. The compression process using ideal gas considerations results in work performed on the system and is essentially the area under a P-V curve. As can be seen in Figure 40, different amounts of work result from different ideal gas processes such as constant temperature and constant pressure.

Fluid
A fluid is any substance that conforms to the shape of its container. It may be either a liquid or a gas.
Compressibility of Fluids
Usually a fluid may be considered incompressible when the velocity of the fluid is greater than one-third of the speed of sound for the fluid, or if the fluid is a liquid. The treatment of a fluid that is considered incompressible is easy because the density is assumed to be constant, giving a simple relationship for the state of the substance. The variation of density of the fluid with changes in pressure is the primary factor considered in deciding whether a fluid is incompressible.
Fluids that are compressible have much more complex equations to deal with, due to density changes, and have property relationships that vary more rapidly than incompressible fluids. In addition, fixing the state of a liquid can be done easily by knowing its temperature and pressure. Once the substance becomes a gas, the process becomes more difficult.
Constant Pressure Process
To determine the work done in a constant pressure process, the following equation is used:
W1-2 = P(∆V) (1-44)
Constant Volume Process
The solution of Equation 1-45 for a constant volume process is also not difficult. The work done in a constant volume process is the product of the volume and the change in pressure.
W1-2 = V(∆P) (1-45)
In addition to gases, Equation 1-45 also applies to liquids. The power requirement for pumps that move incompressible liquids (such as water) can be determined from Equation 1-44. Replacing the volume (V) with the product of the specific volume and the mass yields Equation 1-45.
W1-2 = mν(∆P) (1-46)
Taking the time rate of change of both sides of Equation 1-46 determines the power requirements of the pump.
W1-2m = v(∆P) (1-47)
Effects of Pressure Changes on Fluid Properties
The predominant effect of an increase in pressure in a compressible fluid, such as a gas, is an increase in the density of the fluid. An increase in the pressure of an incompressible fluid will not have a significant effect on the density. For example, increasing the pressure of 100 °F water from 15 psia to 15,000 psia will only increase the density by approximately 6%. Therefore, in engineering calculations, it is assumed that incompressible fluids’ density remain constant.
Effects of Temperature Changes on Fluid Properties
An increase in temperature will tend to decrease the density of any fluid. If the fluid is confined in a container of fixed volume, the effect of a temperature change will depend on whether the fluid is compressible.
If the fluid is a gas, it will respond to a temperature change in a manner predicted by the ideal gas laws. A 5% increase in absolute temperature will result in a 5% increase in the absolute pressure.
If the fluid is an incompressible liquid in a closed container, an increase in the temperature will have a tremendously greater and potentially catastrophic effect. As the fluid temperature increases, it tries to expand, but expansion is prevented by the walls of the container. Because the fluid is incompressible, this results in a tremendous increase in pressure for a relatively minor temperature change. The change in specific volume for a given change in temperature is not the same at various beginning temperatures. Resultant pressure changes will vary. A useful thumb rule for water is that pressure in a water-solid system will increase about 100 psi for every 1 °F increase in temperature.